Topic: Analysis and Interpretation of Financial Statements

Search 500 + past questions and counting.
  • Filter by Professional Bodies

  • Filter by Subject

  • Filter by Series

  • Filter by Topics

  • Filter by Levels

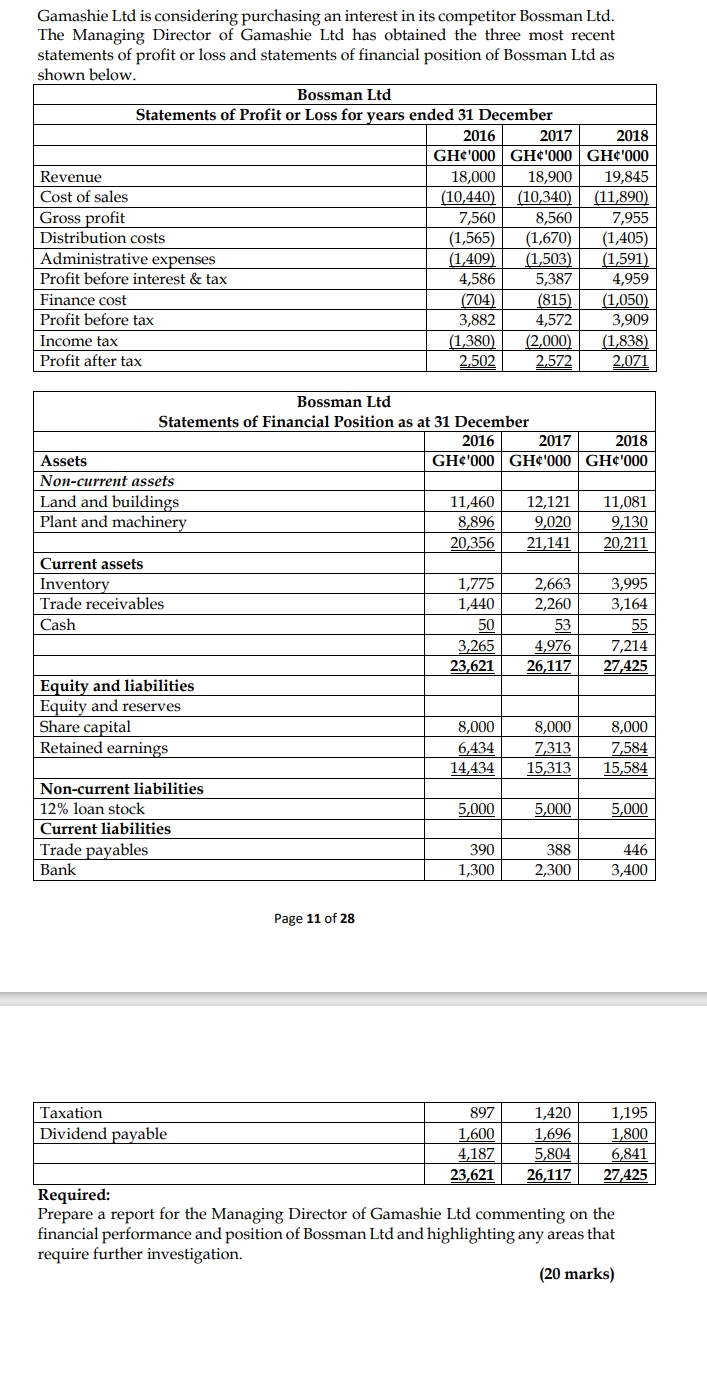
CR – May 2020 – Q5 – Financial Performance and Position of Bossman Ltd

This question involves analyzing the financial performance and position of Bossman Ltd over three years using ratio analysis.

Login or create a free account to see answers

Find Related Questions by Tags, levels, etc.

Report an error

You're reporting an error for "CR – May 2020 – Q5 – Financial Performance and Position of Bossman Ltd"

CR – Nov 2020 – L3 – Q5a – Return on Equity & Return on Capital Employed

Calculate and interpret return on equity and return on capital employed for Bounce Back Ltd for two years.

Bounce Back Ltd Financial Information:

Statement of Comprehensive Income for the year ended 30 November:

2019 2018
Profit before interest and tax GH¢2,200,000 GH¢1,570,000
Interest expense (GH¢170,000) (GH¢150,000)
Profit before tax GH¢2,030,000 GH¢1,420,000
Taxation (GH¢730,000) (GH¢520,000)
Profit after tax GH¢1,300,000 GH¢900,000
Dividends paid (GH¢250,000) (GH¢250,000)
Retained profit GH¢1,050,000 GH¢650,000

Statement of Financial Position as at 30 November:

2019 2018
Non-current assets (written-down value) GH¢6,350,000 GH¢5,600,000
Current assets
Trade receivables GH¢2,100,000 GH¢2,070,000
Inventories GH¢1,710,000 GH¢1,540,000
Total current assets GH¢3,810,000 GH¢3,610,000
Creditors: amounts due within one year
Trade payables GH¢1,040,000 GH¢1,130,000
Taxation GH¢550,000 GH¢450,000
Bank overdraft GH¢370,000 GH¢480,000
Total current liabilities GH¢1,960,000 GH¢2,060,000
Net current assets GH¢1,850,000 GH¢1,550,000
Total net assets GH¢8,200,000 GH¢7,150,000
Creditors: amounts due after more than one year
10% debentures GH¢1,500,000 GH¢1,500,000
Equity
Share capital (ordinary shares of 50p fully paid up) GH¢3,000,000 GH¢3,000,000
Retained earnings GH¢3,700,000 GH¢2,650,000
Total equity GH¢6,700,000 GH¢5,650,000
Total long-term liabilities and equity GH¢8,200,000 GH¢7,150,000

Required:

  1. Calculate, for both years, the return on equity and the return on capital employed.

Login or create a free account to see answers

Find Related Questions by Tags, levels, etc.

Report an error

You're reporting an error for "CR – Nov 2020 – L3 – Q5a – Return on Equity & Return on Capital Employed"

CR – Nov 2020 – L3 – Q5b – Investment Ratios

Calculate two investment ratios of interest to a potential investor for two years.

Calculate, for both years, TWO (2) investment ratios of interest to a potential investor.


Login or create a free account to see answers

Find Related Questions by Tags, levels, etc.

Report an error

You're reporting an error for "CR – Nov 2020 – L3 – Q5b – Investment Ratios"

CR – Nov 2020 – L3 – Q5c – Ratios for Lenders

Calculate two ratios of interest to a potential long-term lender for two years.

Calculate, for both years, TWO (2) ratios of interest to a potential long-term lender.


Login or create a free account to see answers

Find Related Questions by Tags, levels, etc.

Report an error

You're reporting an error for "CR – Nov 2020 – L3 – Q5c – Ratios for Lenders"

CR – Nov 2020 – L3 – Q5d – Performance Analysis

Report on the performance and state of the business using calculated ratios from the viewpoint of shareholders and lenders.

Report on the performance and state of the business from the viewpoint of a potential shareholder and lender using the ratios calculated above and explain any weaknesses in these ratios.


Login or create a free account to see answers

Find Related Questions by Tags, levels, etc.

Report an error

You're reporting an error for "CR – Nov 2020 – L3 – Q5d – Performance Analysis"

CR – May 2021 – L3 – Q5 – Financial performance of Shop First Ltd

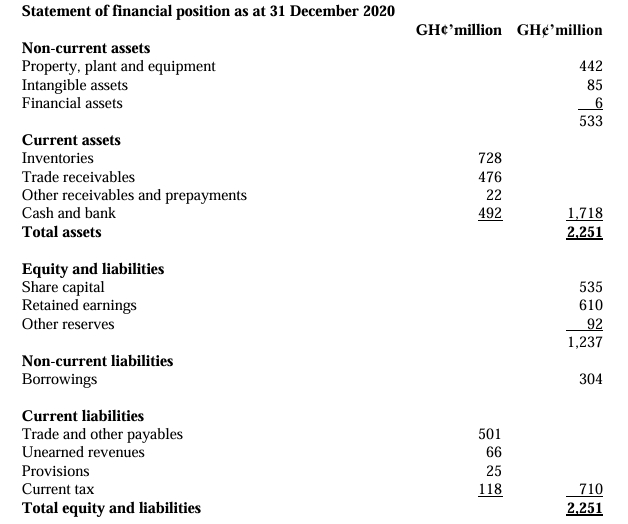
Analyze the financial performance of Shop First Ltd for 2020 and discuss the effects of discontinued operations and contingencies.

Shop First Ltd operates supermarket chains across the sixteen (16) regions of Ghana. The firm has been in commercial operation for more than two decades, growing its operations through an effective supply chain and financial management. However, in the last few years, keen competition and worsening general economic performance have steadied the consistent growths experienced over the years, resulting in the entity disposing off part of its operations. Below are the financial statements of Shop First Ltd:

Login or create a free account to see answers

Find Related Questions by Tags, levels, etc.

Report an error

You're reporting an error for "CR – May 2021 – L3 – Q5 – Financial performance of Shop First Ltd"

CR – May 2019 – L3 – Q4 – Analysis and interpretation of financial statements

The question requires calculation of financial ratios and analysis of the financial performance and cash position of Madina Ltd for the year ended 30 September 2018.

Below are the recently issued financial statements of Madina Ltd, a listed company, for the year ended 30 September 2018, together with comparatives for 2017.

Statement of Profit or Loss for the year ended 30 September:

Details 2018 (GH¢’000) 2017 (GH¢’000)
Revenue 125,000 90,000
Cost of Sales (100,000) (75,000)
Gross Profit 25,000 15,000
Operating Expenses (13,000) (11,000)
Finance Costs (4,000)
Profit before Tax 8,000 4,000
Tax (at 25%) (2,000) (1,000)
Profit for the year 6,000 3,000

Statement of Financial Position as at 30 September:

Details 2018 (GH¢’000) 2017 (GH¢’000)
Non-Current Assets
Property, Plant, and Equipment 105,000 45,000
Goodwill 5,000
Total Non-Current Assets 110,000 45,000
Current Assets
Inventory 12,500 7,500
Receivables 6,500 4,000
Bank 7,000
Total Current Assets 19,000 18,500
Total Assets 129,000 63,500
Equity and Liabilities
Equity
Share Capital 50,000 50,000
Retained Earnings 7,000 6,000
Total Equity 57,000 56,000
Non-Current Liabilities
8% Loan Notes 50,000
Current Liabilities
Bank Overdraft 8,500
Trade Payables 11,500 6,500
Current Tax Payable 2,000 1,000
Total Current Liabilities 22,000 7,500
Total Equity and Liabilities 129,000 63,500

Additional Information:

  • On 1 October 2017, Madina Ltd acquired 100% of the net assets of Aboabu Ltd for GH¢50 million. In order to finance this transaction, Madina Ltd issued GH¢50 million 8% loan notes on the acquisition date.
    Aboabu Ltd’s results for the year ended 30 September 2018 are shown below:

Aboabu Ltd’s Statement of Profit or Loss for the year ended 30 September:

Details GH¢’000
Revenue 35,000
Cost of Sales (20,000)
Gross Profit 15,000
Operating Expenses (4,000)
Profit before Tax 11,000
Tax (at 25%) (2,750)
Profit for the year 8,250
  • Aboabu Ltd has not paid any dividend during the year, but Madina Ltd paid a dividend of GH¢0.05 per share.
  • The following ratios have been calculated for Madina Ltd for the year ended 30 September 2017:
    • Return on capital employed: 7.1%
    • Gross profit margin: 16.7%
    • Net profit (before tax) margin: 4.4%

Required:

a) Calculate the equivalent ratios for Madina Ltd for 2018:
i) Including the results of Aboabu Ltd acquired during the year. (3 marks)
ii) Excluding all effects of the purchase of Aboabu Ltd. (3 marks)

b) Analyse the performance of Madina Ltd for the year ended 30 September 2018. (5 marks)

c) Analyse the cash position of Madina Ltd as at 30 September 2018. (4 marks)

Login or create a free account to see answers

Find Related Questions by Tags, levels, etc.

Report an error

You're reporting an error for "CR – May 2019 – L3 – Q4 – Analysis and interpretation of financial statements"

CR – May 2018 – L3 – Q4c – Analysis and Interpretation of Financial Statements

Analyze and compare the financial performance of two companies in terms of operating performance, liquidity, gearing, and investment ratios.

Fordland Ltd and Fiatland Ltd are two companies in the garment industry. The following are financial ratios computed by the Research Department of ICAG as part of analyzing companies’ performance industry by industry:

Ratios Fordland Ltd Fiatland Ltd
Return on Capital Employed (ROCE) 24.10% 30%
Net Assets Turnover 1.9 times 2.5 times
Gross Profit Margin 35% 20%
Net Profit Margin 10.50% 38%
Current Ratio 1.0:1 2.0:1
Quick Ratio 0.8:1 1.0:1
Inventory Holding Period 60 days 90 days
Receivables Collection Period 58 days 60 days
Payables Payment Period 50 days 50 days
Debt to Equity Ratio 50% 30%
Dividend Yield 3% 2%
Dividend Cover 2 times 1.5 times

Required:
Write a report analyzing and comparing the financial performance of Fordland Ltd and Fiatland Ltd. The report should cover operating performance, liquidity, gearing, and investment ratios. (8 marks)

Login or create a free account to see answers

Find Related Questions by Tags, levels, etc.

Report an error

You're reporting an error for "CR – May 2018 – L3 – Q4c – Analysis and Interpretation of Financial Statements"

CR – April 2022 – L3 – Q5 – Analysis and interpretation of financial statements

Write a report analyzing the financial performance and financial position of Azure Plc using financial ratios and sector averages.

Azure Plc is a company that trades its ordinary shares on the Ghana Stock Exchange. Below are the statements of profit or loss for the year ended 31 December 2020 and for the first three quarters in 2020 published in line with the Ghana Stock Exchange regulations:

Statements of profit or loss of Azure Plc:

Description Year Ended 31 Dec 2020 (Audited) Quarter 3 (Unaudited) Quarter 2 (U

naudited)

Quarter 1 (Unaudited)
Revenue GH¢ 2,829 million GH¢ 544 million GH¢ 810 million GH¢ 624 million
Cost of sales (GH¢ 1,754 million) (GH¢ 346 million) (GH¢ 489 million) (GH¢ 412 million)
Gross profit GH¢ 1,075 million GH¢ 198 million GH¢ 321 million GH¢ 212 million
Other operating income GH¢ 72 million GH¢ 32 million GH¢ 21 million GH¢ 23 million
Administrative expenses (GH¢ 572 million) (GH¢ 94 million) (GH¢ 183 million) (GH¢ 146 million)
Distribution costs (GH¢ 265 million) (GH¢ 73 million) (GH¢ 62 million) (GH¢ 65 million)
Finance costs (GH¢ 15 million) (GH¢ 11 million) (GH¢ 2 million) (GH¢ 2 million)
Profit before tax GH¢ 295 million GH¢ 52 million GH¢ 95 million GH¢ 22 million
Tax (GH¢ 101 million) (GH¢ 17 million) (GH¢ 31 million) (GH¢ 11 million)
Profit for the year GH¢ 194 million GH¢ 35 million GH¢ 64 million GH¢ 11 million

Additional information:
The following ratios have been calculated for the relevant sector for the year ended 31 December 2020:

  • Return on year-end capital employed: 18.30%
  • Return on year-end equity: 16.05%
  • Profit (before interest and tax) margin: 12.1%
  • Gross profit margin: 43.22%
  • Current ratio: 2.60
  • Quick ratio: 1.25
  • Assets turnover: 1.02
  • Debt-to-equity ratio: 30.50%

Required:
Write a report to the Board of Directors of Azure Plc, analyzing the financial performance and financial position of the company using the above information to assist the Board in determining whether strategic adjustments are required and where, if any.
(20 marks)

Login or create a free account to see answers

Find Related Questions by Tags, levels, etc.

Report an error

You're reporting an error for "CR – April 2022 – L3 – Q5 – Analysis and interpretation of financial statements"

CR – Nov 2021 – L3 – Q5 – Analysis and Interpretation of Financial Statements

Produce a report analyzing the cash flow performance of Saglema Plc relative to a competitor over two years and explain the uses and limitations of cash flow analysis.

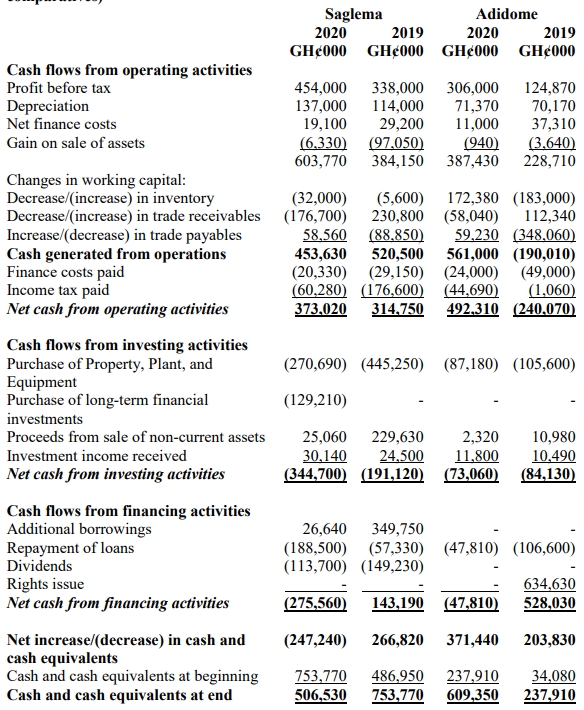
You are the Senior Financial Accountant at Saglema Plc (Saglema), a company that manufactures and sells painting materials in the local market and around the West African sub-region. At the first one-on-one meeting with the recently appointed chairperson of your company’s governing board, she asked you to produce a concise report on Saglema’s cash flow performance relative to that of Adidome Plc (Adidome), a close competitor, over the last two years.

The following are the cash flow statements for the last two years for Saglema and Adidome:

Cash Flow Statements for the Year Ended 31 August 2020 (together with comparatives):

Required:

i) Produce a report showing the comparative analysis of the cash flow performance and situation of Saglema over the last two years, relative to that of Adidome. (15 marks)
ii) Explain TWO (2) uses and THREE (3) limitations of such analysis. (5 marks)

Login or create a free account to see answers

Find Related Questions by Tags, levels, etc.

Report an error

You're reporting an error for "CR – Nov 2021 – L3 – Q5 – Analysis and Interpretation of Financial Statements"

CR – Dec 2022 – L3 – Q5 – Analysis and Interpretation of Financial Statements

Evaluate Partey Ltd's performance using key financial ratios for profitability, liquidity, efficiency, and gearing.

Partey Ltd is a company engaged in continuous casting and cold rolling of aluminum products in Ghana. The company has been in operation for several decades, and its operations did not change in the year ended 31 December 2021.

Below are financial statements for the years 2021 and 2020:

Statement of Profit or Loss and Other Comprehensive Income

2021 (GH¢000) 2020 (GH¢000)
Revenue 389,507 445,963
Cost of sales (240,731) (237,345)
Gross profit 148,776 208,618
Other income 19,315 10,983
Distribution costs (76,366) (108,137)
Administrative expenses (74,520) (46,216)
Operating profit 17,205 65,248
Finance cost (21,287) (21,537)
Profit before tax (4,082) 43,711
Tax expense (16,521)
Profit for the year (4,082) 27,190

Statement of Financial Position

2021 (GH¢000) 2020 (GH¢000)
Non-current assets:
Property, plant and equipment 196,784 183,190
Investment securities 137 348
Total non-current assets 196,921 183,538
Current assets:
Inventories 50,400 66,351
Trade receivables 23,769 27,688
Other receivables 9,343 1,833
Cash and cash equivalents 45,969 20,699
Total current assets 129,481 116,571
Total assets 326,402 300,109
Equity and Liabilities:
Stated capital 10,000 10,000
Retained earnings 124,575 111,676
Total equity 134,575 121,676
Non-current liabilities:
15% Loan notes 8,580 10,247
20% Loan notes (NGIC Pension Fund) 100,000 100,000
Total non-current liabilities 108,580 110,247
Current liabilities:
Trade payables 80,182 65,082
Current tax 3,104
Accrued expenses 3,065
Total current liabilities 83,247 68,186
Total equity and liabilities 326,402 300,109

Required:

a) As the Finance Manager of Partey Ltd, you have been tasked by the Board of Directors to produce a report. Assess the performance of the company over time based on profitability, liquidity, efficiency, and gearing.
(Note: Your report should include TWO (2) ratios each of profitability, liquidity, efficiency, and gearing).
(16 marks)

b) Management of the company wants to achieve improvement in technology and production processes to stimulate growth. However, this will require further injection of funds and less strain on operating cash flows. To achieve this, the Board of Directors of the company has resolved to convince the company’s largest debtholder, NGIC Pension Fund, to exercise the conversion right attached to the debt. The total value of the debt included in the financial statements for both financial years is GH¢100 million. The debt was issued at a coupon rate of 20% per annum. The annual coupon payments are also included in the financial statements above for both financial years. NGIC Pension Fund is also the second-largest shareholder of the company.

The estimated tax expense on the company’s profit for the year ended 31 December 2021, if the debt owed to NGIC Pension Fund is converted, is GH¢3.172 million. Current tax liability at 31 December 2021 is expected to increase by the same amount.

Required:
Assess the performance of the company for the year ended 31 December 2021 upon conversion of the debt owed to NGIC Pension Fund on 1 January 2021 at its carrying amount.
(4 marks)

Login or create a free account to see answers

Find Related Questions by Tags, levels, etc.

Report an error

You're reporting an error for "CR – Dec 2022 – L3 – Q5 – Analysis and Interpretation of Financial Statements"

error: Content is protected !!
Oops!

This feature is only available in selected plans.

Click on the login button below to login if you’re already subscribed to a plan or click on the upgrade button below to upgrade your current plan.

If you’re not subscribed to a plan, click on the button below to choose a plan