Subject: QUANTITATIVE TECHNIQUES IN BUSINESS (QTB)

Search 500 + past questions and counting.
  • Filter by Professional Bodies

  • Filter by Subject

  • Filter by Series

  • Filter by Topics

  • Filter by Levels

PSAF – May 2018 – L2 – Q5 – The Budgeting Process in the Public Sector

Explains the concept of a national budget, surplus and deficit budget implications, and challenges in the implementation of national budgets in Nigeria.

In government’s quest to optimally develop and efficiently manage available resources, national budgets are usually prepared to put economic development firmly on course.

Required:

a. Describe briefly a national budget. (3 Marks)

b. Explain briefly the implication of each of the following for the performance of the economy: i. A surplus budget ii. A deficit budget (4 Marks)

c. Explain FOUR problems to be encountered in the effective implementation of national budgets in Nigeria. (8 Marks)

Login or create a free account to see answers

Find Related Questions by Tags, levels, etc.

Report an error

You're reporting an error for "PSAF – May 2018 – L2 – Q5 – The Budgeting Process in the Public Sector"

QTB – Nov 2014 – L1 – SB – Q6 – Mathematics of Business Finance

Calculate the value of an investment with compound interest, the payoff amount for a loan with simple interest, and the additional interest for a loan with monthly payments and reduced interest rates.

a. If N250,000 is invested in an account that earns 4% per year compound interest, what is the:
i. value of the investment after 5 years? (3 Marks)
ii. total interest earned? (2 Marks)

b. When it was apparent that your parents could not afford to finance your university education, you sought and obtained a 4-year loan of N250,000.00 from Education Bank Limited. The bank imposed a simple interest rate of 7½%.
i. How much do you need to pay off the bank now

(4 years after) that you are through with your study?

(7 Marks)
ii. If you decide to be paying N25,000 every month from now and the bank agreed to reduce the interest rate to 1% per month on the unpaid balance at the beginning of the month, how much additional total interest will be paid? (8 Marks)

Login or create a free account to see answers

Find Related Questions by Tags, levels, etc.

Report an error
You're reporting an error for "QTB – Nov 2014 – L1 – SB – Q6 – Mathematics of Business Finance"

QTB – Nov 2014 – L1 – SB – Q5b – Data Collection Analysis

Draw a frequency polygon and an ogive based on gasoline mileage data from an experiment.

In a particular organisation, an experiment which was conducted to determine the gasoline mileage of a particular type of car yielded the following data:

Miles per gallon Percent
10 and under 12 4
13 and under 15 8
16 and under 18 14
19 and under 21 26
22 and under 24 12
25 and under 27 11
28 and under 30 10
31 and under 33 7
34 and under 36 6
37 and under 39 2

Required:

i. Draw the frequency polygon for gasoline mileage. (5 Marks)
ii. Draw the ogive for gasoline mileage. (5 Marks)

Login or create a free account to see answers

Find Related Questions by Tags, levels, etc.

Report an error
You're reporting an error for "QTB – Nov 2014 – L1 – SB – Q5b – Data Collection Analysis"

QTB – Nov 2014 – L1 – SB – Q5a – Statistics

Calculate the Spearman's rank correlation coefficient between the scores in two subjects and interpret the result.

A business school preparing candidates for professional examinations conducted a mock examination to ascertain the level of preparedness of its candidates in two subjects: Quantitative Techniques in Business (QTB) and Management Information (MI). The table below gives the scores of twelve selected candidates.

Candidates 1 2 3 4 5 6 7 8 9 10 11 12
Score in QTB (x) 35 77 95 28 76 80 90 62 39 65 90 37
Score in MI (y) 50 82 89 58 65 61 84 59 48 53 80 52

Required:
i. Calculate the Spearman’s rank correlation coefficient between xx and yy. (9 Marks)
ii. Comment on the result in (i) above. (1 Mark)

Login or create a free account to see answers

Find Related Questions by Tags, levels, etc.

Report an error

You're reporting an error for "QTB – Nov 2014 – L1 – SB – Q5a – Statistics"

QTB – Nov 2014 – L1 – SB – Q4 – Forecasting

Analyze sales data using the Least Squares Method and forecast future sales based on the trend.

The sales of PQR Nigeria Plc. in thousands of Naira are listed in the table below for each quarter for years 2005 – 2008.

Sales of PQR in N’000s

Year Quarter 1 Quarter 2 Quarter 3 Quarter 4
2005 22 35 82 37
2006 24 46 81 44
2007 25 40 87 49
2008 29 42 100 55

Required:

a. Calculate the trend in the above data using the Least Squares Method. (12 Marks)
b. Estimate the sales for each quarter using the trend line. (4 Marks)
c. Calculate the percentage variation for each quarter’s actual sales from the estimate obtained in (b) above. (4 Marks)

(Total: 20 Marks)

Login or create a free account to see answers

Find Related Questions by Tags, levels, etc.

Report an error

You're reporting an error for "QTB – Nov 2014 – L1 – SB – Q4 – Forecasting"

QTB – Nov 2014 – L1 – SB – Q3 – Operations Research

Calculate control levels for inventory, expected time for a project, and identify the critical path in a network diagram.

a. Calculate the various control levels from the following data on a given inventory item:

  • Normal usage: 1,600 per day
  • Minimum usage: 1,000 per day
  • Maximum usage: 3,000 per day
  • Lead time: 16 – 20 days
  • EOQ: 40,000
    (9 Marks)

b. If the optimistic, most likely, and pessimistic times are given as 11 days, 15 days, and 18 days respectively, calculate the expected time of the project delivery.
(3 Marks)

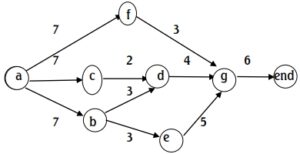
c. The network for a small building project is shown below together with the time in days required to complete each task.

Required:

i. List the possible paths together with their durations through the network. (6 Marks)
ii. State the critical path and the project duration. (2 Marks)

(Total: 20 Marks)

Login or create a free account to see answers

Find Related Questions by Tags, levels, etc.

Report an error

You're reporting an error for "QTB – Nov 2014 – L1 – SB – Q3 – Operations Research"

QTB – Nov 2014 – L1 – SB – Q2 – Measures of Dispersion

Compare the risk and return of two investments by calculating mean and standard deviation.

In finance, the standard deviation is frequently used to measure the risk of an investment.
An investor is considering two possible investments A and B. A sample of 10 rates of return is recorded for each investment. These rates of return, given as percentages, are as follows:

Investment A:
4, 6, 6, 5, 4, 5, 8, 5, 5, 8

Investment B:
0, -2, 6, 12, 9, 16, -4, 16, 25, 12

Required:
a. Calculate the mean rate of return for each of the two investments. (6 Marks)
b. Calculate the standard deviation of the rate of return for each of the investments. (6 Marks)
c. Which of the two investments is riskier and why? (8 Marks)

(Total: 20 Marks)

Login or create a free account to see answers

Find Related Questions by Tags, levels, etc.

Report an error

You're reporting an error for "QTB – Nov 2014 – L1 – SB – Q2 – Measures of Dispersion"

QTB – Nov 2014 – L1 – SB – Q1b – Mathematics of Business Finance

Determine the total sum of money the Chief Accountant of Zeesco Plc. plans to donate to 4 not-for-profit organisations, given the donations for each organisation.

The Chief Accountant of Zeesco Plc. has a large sum of money which she plans to donate to 4 not-for-profit organisations. She plans to give  of this amount to organisation A. Out of the remaining amount, she plans to give    to organisation B. Also, she intends to give           of the balance to organisation C and the rest to organisation D. If she plans to give 11 million naira to organisation D, how much does she plan to share among these organisations?

Login or create a free account to see answers

Find Related Questions by Tags, levels, etc.

Report an error

You're reporting an error for "QTB – Nov 2014 – L1 – SB – Q1b – Mathematics of Business Finance"

QTB – May 2017 – L1 – SB – Q6b – Data Collection Analysis

Calculate the mode and Pearson's coefficient of skewness for a given distribution of marks.

The table below shows the marks (%) scored in QTB by some candidates who wrote the ICAN Professional examination in May 2016 diet:

Marks % Number of Candidates
20–29 7
30–39 17
40–49 13
50–59 9
60–69 4

If the mean mark is 41.7%, calculate the mode and Pearson’s coefficient of skewness. (10 Marks)

Login or create a free account to see answers

Find Related Questions by Tags, levels, etc.

Report an error

You're reporting an error for "QTB – May 2017 – L1 – SB – Q6b – Data Collection Analysis"

QTB – Nov 2014 – L1 – SB – Q1a – Mathematics of Business Finance

Determine the cost of calculators and books using a system of linear equations and solve for individual costs.

The cost of purchasing 8 calculators and 10 books is 158 (thousands of naira).
At another instance, the cost of purchasing 15 calculators and 3 books is 123 (thousands of naira).

Required:
i. Use the information above to write down a system of linear equations to describe the given cost scenario. (4 Marks)
ii. Solve the resulting system of equations. (4 Marks)
iii. Find the cost of each calculator and each book. (2 Marks)

Login or create a free account to see answers

Find Related Questions by Tags, levels, etc.

Report an error

You're reporting an error for "QTB – Nov 2014 – L1 – SB – Q1a – Mathematics of Business Finance"

QTB – Nov 2014 – L1 – SA – Q9 – Data Collection Analysis

Calculates the first quartile (Q1) of the given frequency distribution.

The table below shows the frequency distribution of marks obtained by 36 students in a class:

Class Marks Frequencies
0 but less than 5 6
5 but less than 10 10
10 but less than 15 8
15 but less than 20 12

The first quartile of the distribution is:
A. 6.0
B. 6.2
C. 6.3
D. 6.4
E. 6.5

Login or create a free account to see answers

Find Related Questions by Tags, levels, etc.

Report an error

You're reporting an error for "QTB – Nov 2014 – L1 – SA – Q9 – Data Collection Analysis"

QTB – Nov 2014 – L1 – SA – Q8 – Queuing Models

Determines the average service time in a bank given the arrival rate and service time.

Question: The mean arrival rate (µ) in a bank is observed to be one customer in every 4 minutes, and the mean service time   is 2½ minutes per customer. The average time of service in the bank is:
A. 1.04 minutes
B. 1.67 minutes
C. 6.67 minutes
D. 6.76 minutes
E. 10.0 minutes

Login or create a free account to see answers

Find Related Questions by Tags, levels, etc.

Report an error

You're reporting an error for "QTB – Nov 2014 – L1 – SA – Q8 – Queuing Models"

QTB – Nov 2014 – L1 – SA – Q7 – Operations Research

Identifies the components necessary for a linear programming problem.

The building blocks for a linear programming problem are:
A. A linear objective function and equality of constraints
B. A linear objective function and inequality constraints
C. A linear objective function, structural linear inequality constraints, and non-negativity constraints on the decision variables
D. A linear objective function, structural linear inequality constraints, and negativity constraints on the decision variables
E. A linear objective function and structural non-linear inequality constraints

Login or create a free account to see answers

Find Related Questions by Tags, levels, etc.

Report an error

You're reporting an error for "QTB – Nov 2014 – L1 – SA – Q7 – Operations Research"

QTB – Nov 2014 – L1 – SA – Q5 – Statistics

Identifies the correct measure of relationship between variables.

The measure of relationship that exists between two or more variables is known as the coefficient of:
A. Skewness
B. Variation
C. Kurtosis
D. Determination
E. Correlation

Login or create a free account to see answers

Find Related Questions by Tags, levels, etc.

Report an error

You're reporting an error for "QTB – Nov 2014 – L1 – SA – Q5 – Statistics"

QTB – Nov 2014 – L1 – SA – Q4 – Statistics

Uses a regression equation to estimate the number of candidates enrolling based on total sales figures.


An Accountant, with a fast food restaurant located in a professional examination centre, estimated that the regression equation relating to the total sales, y (in thousands of naira) and the number of candidates, x, that enrolled for the examination over 6 diets is given as  y = 150 +5x.
The number of candidates that will enrol for a particular diet if its estimated total sales is N950,000 is:
A. 160
B. 360
C. 450
D. 620
E. 700

Login or create a free account to see answers

Find Related Questions by Tags, levels, etc.

Report an error

You're reporting an error for "QTB – Nov 2014 – L1 – SA – Q4 – Statistics"

QTB – Nov 2014 – L1 – SA – Q3 – Probability

Determines the probability that daily sales exceed a specified value, given a normal distribution with known mean and standard deviation.

The daily sales figures of a supermarket follow a normal distribution with a mean of N60,000 and a standard deviation of N14,000. Find the probability that the sales figure of a certain day exceeds N46,000.
A. 0.1587
B. 0.1590
C. 0.8413
D. 0.8415
E. 0.8423

Login or create a free account to see answers

Find Related Questions by Tags, levels, etc.

Report an error

You're reporting an error for "QTB – Nov 2014 – L1 – SA – Q3 – Probability"

QTB – Nov 2014 – L1 – SA – Q2 – Probability

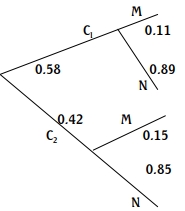
Determines the probability that a customer does not receive a mutilated note from the cashiers.

The following tree diagram shows the scenario with two paying cashiers (C1 and C2) at a Microfinance Bank where M represents mutilated notes and N represents new notes:

he probability that a customer of the bank does not receive a mutilated note is:
A. 0.1125
B. 0.8725
C. 0.8875
D. 0.8525
E. 0.8850

Login or create a free account to see answers

Find Related Questions by Tags, levels, etc.

Report an error

You're reporting an error for "QTB – Nov 2014 – L1 – SA – Q2 – Probability"

QTB – Nov 2014 – L1 – SA – Q1 – Probability

Determines the correct definition of mutually exclusive events.

Two events are said to be mutually exclusive if
A. The occurrence (or non-occurrence) of one event does not affect the occurrence (or non-occurrence) of the other event
B. Both events can occur simultaneously
C. The occurrence of one event precludes the occurrence of the other event
D. Both are impossible events

Login or create a free account to see answers

Find Related Questions by Tags, levels, etc.

Report an error

You're reporting an error for "QTB – Nov 2014 – L1 – SA – Q1 – Probability"

QTB – May 2016 – L1 – SB – Q6b – Operations Research

This question involves calculating seasonal adjustments based on moving average analysis for sales data.

i. The following moving average analysis is obtained for the quarterly sales of a bakery based on the additive model:

Quarter Trend Actual Sales in the Quarter Variation (Actual – Trend)
Year 1: Q3 29.375 29 -0.375
Year 1: Q4 33.125 33 -0.125
Year 2: Q1 37.125 37 -0.125
Year 2: Q2 41.250 41 -0.250
Year 2: Q3 45.000 46 1.000
Year 2: Q4 47.875 48 0.125
Year 3: Q1 53.000 51 -2.000
Year 3: Q2 57.125 58 0.875

Required:
Calculate the seasonal adjustment for each quarter.
(6 marks)

ii. An electrical bulb-making company runs a production line that contains 760 bulbs of the same wattage. These bulbs fail on a regular basis according to the following probability distribution:

Life (months) Probability of Failure (P)
1 0.27
2 0.56
3 0.17

Required:
If the cost of replacing a bulb is N60, determine the following:

  • The life span (2 marks)
  • The average number of replacements in the period (1 mark)
  • The average monthly cost of replacing the bulbs. (1 mark)

Login or create a free account to see answers

Find Related Questions by Tags, levels, etc.

Report an error

You're reporting an error for "QTB – May 2016 – L1 – SB – Q6b – Operations Research"

QTB – May 2016 – L1 – SB – Q6a – Data Collection Analysis

This question involves calculating moving averages and centered moving averages for quarterly sales data.

The quarterly sales figures of company ABC Plc. for 3 years are as recorded below:

Year Quarter 1 Quarter 2 Quarter 3 Quarter 4
Year 1 30 34 37 41
Year 2 45 49 54 57
Year 3 59 66 70 74

Required:
i. Calculate:

  • The moving averages.
    (9 marks)

ii. The centered moving average for Quarter 3, Year 1.
(1 mark)

Login or create a free account to see answers

Find Related Questions by Tags, levels, etc.

Report an error

You're reporting an error for "QTB – May 2016 – L1 – SB – Q6a – Data Collection Analysis"

error: Content is protected !!
Oops!

This feature is only available in selected plans.

Click on the login button below to login if you’re already subscribed to a plan or click on the upgrade button below to upgrade your current plan.

If you’re not subscribed to a plan, click on the button below to choose a plan