Topic: Forecasting Techniques

Search 500 + past questions and counting.
  • Filter by Professional Bodies

  • Filter by Subject

  • Filter by Series

  • Filter by Topics

  • Filter by Levels

MI – Nov 2020 – L1 – SA – Q1 – Forecasting Techniques

The question asks to calculate the Economic Order Quantity (EOQ) based on holding costs, ordering costs, and annual demand.

A company uses 40,000 units of an item per annum. It is recorded that the holding costs are N4 per annum and the ordering cost is N50 per order. The Economic order Quantity is:

A. 2,500
B. 1,500
C. 1,000
D. 800
E. 500

Login or create a free account to see answers

Find Related Questions by Tags, levels, etc.

Report an error

You're reporting an error for "MI – Nov 2020 – L1 – SA – Q1 – Forecasting Techniques"

MI – Nov 2021 – L1 – SA – Q7 – Forecasting Techniques

Calculate the EOQ for minimizing total cost.

ABCD uses 240,000 units of material BC each year, which cost ₦5.40 for each unit after a 10% discount. The cost of making an order for the year is ₦15,312.50. Find the quantity that will minimize the total cost.

A. 36,893 units
B. 35,000 units
C. 26,087 units
D. 24,745 units
E. 24,000 units

Login or create a free account to see answers

Find Related Questions by Tags, levels, etc.

Report an error

You're reporting an error for "MI – Nov 2021 – L1 – SA – Q7 – Forecasting Techniques"

MI – Nov 2021 – L1 – SA – Q2 – Forecasting Techniques

Identify the limitation that does not apply to scatter diagrams

Which of the following is NOT a limitation of scatter diagram?

A. Quickest and easiest approach to cost estimation
B. Drawing the line of the best fit can be quite subjective
C. It indicates a relationship where there is none
D. It only shows relationship between two variables at a time
E. It might lead to incorrect conclusions

Login or create a free account to see answers

Find Related Questions by Tags, levels, etc.

Report an error

You're reporting an error for "MI – Nov 2021 – L1 – SA – Q2 – Forecasting Techniques"

MI – Nov 2014 – L1 – SA – Q4 – Forecasting Techniques

Calculate the capacity ratio based on the labour hours and standard hours data.

The following data were extracted from the records of ABZ Limited for the month of July:

  • Budgeted Labour hours: 6,400
  • Actual Labour hours: 6,240
  • Standard hours produced: 6,480

Calculate the capacity ratio:

A. 103%
B. 102.56%
C. 98%
D. 97.5%
E. 97%

Login or create a free account to see answers

Find Related Questions by Tags, levels, etc.

Report an error

You're reporting an error for "MI – Nov 2014 – L1 – SA – Q4 – Forecasting Techniques"

MI – Nov 2023 – L1 – SB – Q3 – Forecasting Techniques

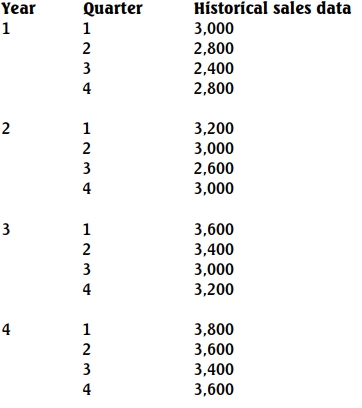
Calculation of moving averages, trends, and seasonal variations based on four years of historical sales data.

The figures given below are four years’ historical sales data of a company.

Required:
Calculate the moving averages, trends, and seasonal variations.

Login or create a free account to see answers

Find Related Questions by Tags, levels, etc.

Report an error

You're reporting an error for "MI – Nov 2023 – L1 – SB – Q3 – Forecasting Techniques"

MI – May 2017 – L1 – SB – Q2 – Forecasting Techniques

Determine fixed and variable costs using high-low method and linear regression analysis.

MICRA Manufacturing Company makes a product named as VATA. The records of some of the manufacturing expenses are easily identified as fixed or directly varied with production. The cost accountant of the company is confronted with the problem of preparing a budget for the coming year and wishes to determine the fixed and variable elements of the mixed factory overhead.

The following monthly information in respect of output and mixed factory overhead are provided as follows:

MONTH NUMBER OF UNITS (x) MIXED FACTORY OVERHEAD (y)
JANUARY 150 80
FEBRUARY 200 100
MARCH 300 135
APRIL 250 125
MAY 300 130
JUNE 250 120
JULY 350 140
AUGUST 300 125
SEPTEMBER 250 115
OCTOBER 150 80

Required:

a. Calculate the fixed and variable elements of the above mixed factory overhead using the high and low method. (5 Marks)

b. Use the linear regression analysis and determine the line of best fit. (15 Marks)

Login or create a free account to see answers

Find Related Questions by Tags, levels, etc.

Report an error

You're reporting an error for "MI – May 2017 – L1 – SB – Q2 – Forecasting Techniques"

error: Content is protected !!
Oops!

This feature is only available in selected plans.

Click on the login button below to login if you’re already subscribed to a plan or click on the upgrade button below to upgrade your current plan.

If you’re not subscribed to a plan, click on the button below to choose a plan