- 20 Marks
Question
Ehis Marvel, a public company, is a high street retailer that sells clothing and food. The managing director is very disappointed with the current year’s result. The company expanded its operations and commissioned a famous designer to restyle its clothing products. This has led to increased sales in both retail lines, yet overall profits are down.
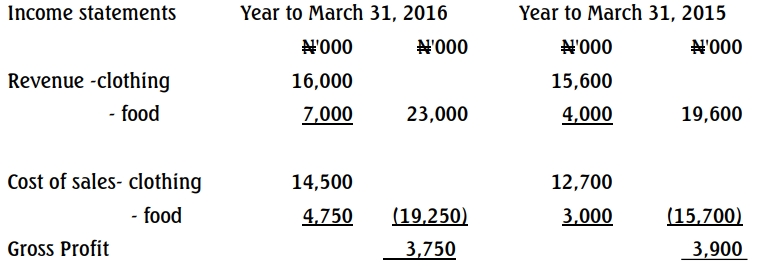
Extract from the Income Statement for the two years to March 31, 2016, are shown:

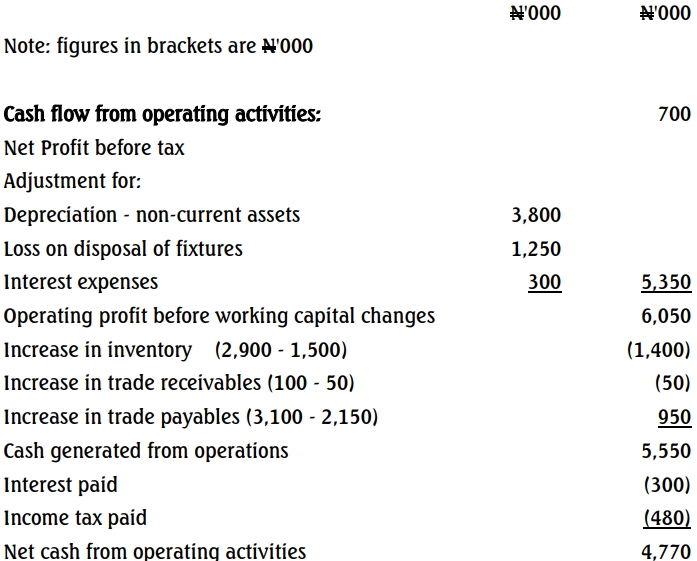
Ehis Marvel Plc – Statement of cash flow for the year to March 31, 2016


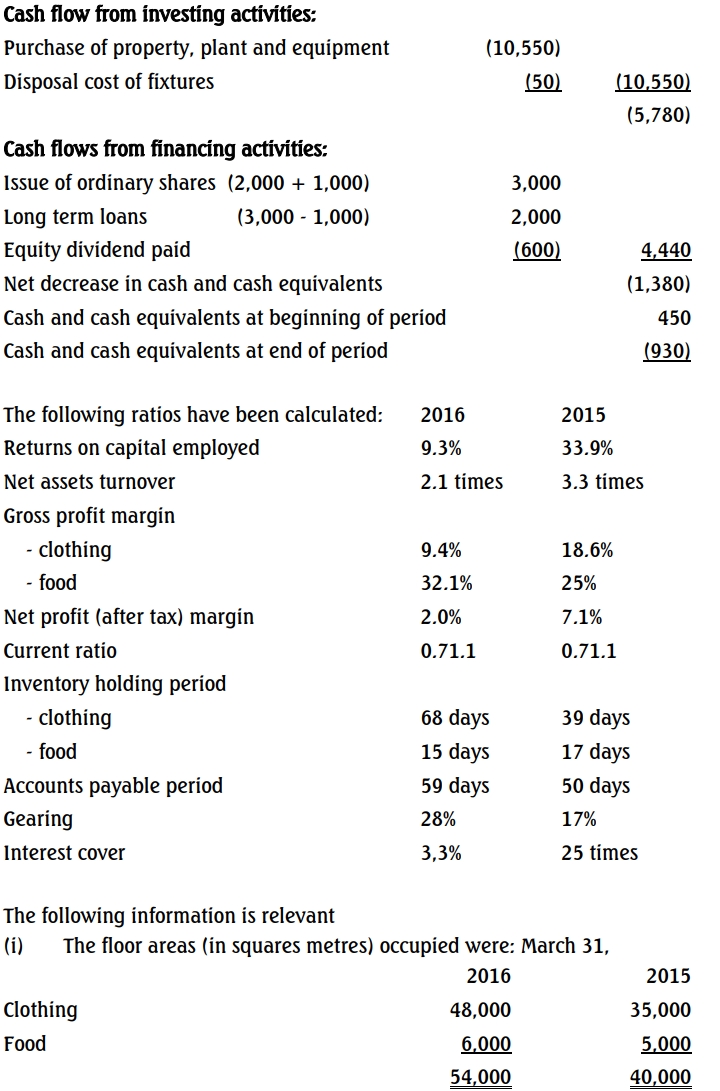
(ii) The share price of Ehis Marvel Plc averaged N6.00 during the year to March 31, 2015, but was only N3.00 at March 31, 2016.
Required:
Write a report analysing the financials of Ehis Marvel Plc, utilising the above ratios and the information in the statement of cash flows for the two years ended March 31, 2016. Your report should refer to the relative performance of the clothing and food sales and be supported by any further ratios you consider appropriate.
Answer
Report on the Financial Performance of Ehis Marvel Plc for the Years Ended March 31, 2016, and March 31, 2015
To: Managing Director, Ehis Marvel Plc
From: Chief Financial Officer
Date: [Insert Date]
Subject: Financial Performance Analysis
Introduction
This report provides an analysis of the financial performance of Ehis Marvel Plc for the years ended March 31, 2016, and March 31, 2015. The focus is on operational performance, liquidity, and capital structure, with insights into the relative performance of the clothing and food divisions.
1. Operational Performance
a. Profitability
- Return on Capital Employed (ROCE) fell sharply from 33.9% in 2015 to 9.3% in 2016, driven by lower profitability and asset efficiency.
- Gross profit margin:
- Clothing declined significantly from 18.6% to 9.4%, reflecting inefficiencies and possibly higher cost of goods or pricing issues.
- Food improved to 32.1% from 25%, demonstrating stronger performance in this segment.
b. Revenue Growth and Contribution
- Total revenue grew by 17.3% (from ₦19,600k to ₦23,000k), primarily driven by food sales which increased by 75% (₦4,000k to ₦7,000k).
- Clothing revenue increased marginally by 2.6% (₦15,600k to ₦16,000k), despite expanded floor space.
c. Efficiency Metrics
- Net asset turnover declined from 3.3 times to 2.1 times, indicating reduced efficiency in utilizing assets to generate revenue.
- Sales per square metre (calculated):
- Clothing: ₦333k (2016) vs ₦446k (2015).
- Food: ₦1,167k (2016) vs ₦800k (2015).
Conclusion:
The food division significantly outperformed the clothing division in profitability and efficiency. However, the expansion in clothing floor space did not translate to proportional revenue growth or efficiency gains.
2. Liquidity and Working Capital Management
a. Current Ratio
- The current ratio remained static at 0.71:1, reflecting a weak ability to cover short-term liabilities with current assets.
b. Inventory Holding Period
- Clothing inventory increased sharply from 39 days to 68 days, raising concerns about overstocking or slow-moving inventory.
- Food inventory improved marginally, reducing from 17 days to 15 days, signaling better inventory management.
c. Trade Payables
- The accounts payable period increased from 50 days to 59 days, indicating a stretched payment cycle likely used to manage liquidity.
d. Cash Flow Analysis
- Operating activities generated ₦4,770k, reflecting strong cash generation despite weak profitability.
- Investing activities incurred a significant outflow of ₦10,550k, primarily due to capital expenditure on new property, plant, and equipment (PPE).
- Financing activities generated ₦4,440k from share issuance and long-term loans.
- Overall cash position deteriorated, leading to a net overdraft of ₦930k (from a cash surplus of ₦450k in 2015).
Conclusion:
Liquidity remains a critical challenge, exacerbated by significant capital investments. Improved working capital management is essential, particularly in reducing clothing inventory levels.
3. Capital Structure and Shareholder Returns
a. Gearing
- Gearing increased from 17% to 28%, reflecting greater reliance on debt financing. However, the overall level remains moderate.
- Interest cover dropped significantly from 25 times to 3.3 times, raising concerns about the company’s ability to service its debt sustainably.
b. Shareholder Returns
- The share price fell by 50%, from ₦6.00 in 2015 to ₦3.00 in 2016, reflecting diminished market confidence.
- Despite weaker profitability, dividends were maintained at ₦600k, potentially straining cash reserves.
Conclusion:
The increased debt levels and weakened interest cover are concerning. Maintaining dividends amidst declining profitability could adversely affect long-term financial stability.
4. Recommendations
- Focus on Food Division:
- Capitalize on the strong performance and efficiency of the food segment to drive growth and profitability.
- Consider reallocating resources from clothing to food to improve returns.
- Optimize Clothing Operations:
- Review pricing strategies and supply chain efficiencies to reduce costs and improve margins.
- Address overstocking to reduce inventory holding periods and improve liquidity.
- Enhance Liquidity Management:
- Tighten working capital policies to reduce reliance on payables for cash flow.
- Consider deferring dividends until profitability and cash flows improve.
- Improve Debt Management:
- Cautiously manage further borrowing to avoid exacerbating interest cover issues.
-
5. Additional Ratios for Insight
Ratio 2016 2015 Sales per sqm (Overall) ₦426k ₦490k Clothing Sales per sqm ₦333k ₦446k Food Sales per sqm ₦1,167k ₦800k
Conclusion
Ehis Marvel Plc faces significant challenges in clothing operations and overall profitability. The company’s strong performance in the food segment and operational cash flow provide a foundation for recovery, but strategic realignments are essential.
Signed,
[Name], Chief Financial Officer
- Tags: Cash Flow Analysis, Gearing, Inventory Turnover, Liquidity, Profitability, ROCE
- Level: Level 3
- Uploader: Kofi

