Question
Some time ago, Robert launched a new product. Initially, sales were strong, but recent figures have raised concerns. Robert seeks a more accurate sales forecast to create detailed cash projections. The sales data below illustrates an underlying trend derived from an averaging method:
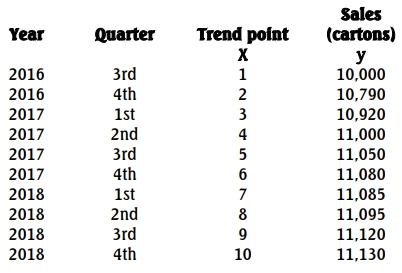
| Year | Quarter | Trend Point (x) | Sales (Cartons) (y) |
|---|---|---|---|
| 2016 | 3rd | 1 | 10,000 |
| 2016 | 4th | 2 | 10,760 |
| 2017 | 1st | 3 | 10,920 |
| 2017 | 2nd | 4 | 11,000 |
| 2017 | 3rd | 5 | 11,050 |
| 2017 | 4th | 6 | 11,080 |
| 2018 | 1st | 7 | 11,085 |
| 2018 | 2nd | 8 | 11,095 |
| 2018 | 3rd | 9 | 11,120 |
| 2018 | 4th | 10 | 11,130 |
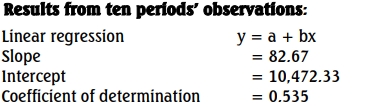
On average, quarters 1 and 3 are 5% and 6% above the trend, respectively, while quarters 2 and 4 are 2% and 9% below it. Preliminary calculations for the 10 periods yield:
- Linear Regression: y = a + bx
- Slope: 82.67
- Intercept: 10,472.33
- Coefficient of determination: 0.535
Forecasting is needed for quarters 3 and 4 in 2019 and quarters 1 and 2 in 2020. There is a debate about using data from all 10 periods versus only the last 5. Analysis for the last five periods includes:
Results of last five periods‟ observations

(Note: y values are scaled down by 100 for ease of calculation.)
Required:
a. Forecast sales for the four quarters using the 10-period data. (8 Marks)
b. Prepare similar forecasts using the last five periods of data. (8 Marks)
c. Evaluate which data set provides the better forecast. (4 Marks)