Question Tag: Seasonality

Search 500 + past questions and counting.
  • Filter by Professional Bodies

  • Filter by Subject

  • Filter by Series

  • Filter by Topics

  • Filter by Levels

PM – May 2021 – L2 – Q3 – Cost-Volume-Profit (CVP) Analysis

Forecast future sales using historical data and analyze which data period provides a better basis for forecasting.

Some time ago, Robert launched a new product. Initially, sales were strong, but recent figures have raised concerns. Robert seeks a more accurate sales forecast to create detailed cash projections. The sales data below illustrates an underlying trend derived from an averaging method:

Year Quarter Trend Point (x) Sales (Cartons) (y)
2016 3rd 1 10,000
2016 4th 2 10,760
2017 1st 3 10,920
2017 2nd 4 11,000
2017 3rd 5 11,050
2017 4th 6 11,080
2018 1st 7 11,085
2018 2nd 8 11,095
2018 3rd 9 11,120
2018 4th 10 11,130

On average, quarters 1 and 3 are 5% and 6% above the trend, respectively, while quarters 2 and 4 are 2% and 9% below it. Preliminary calculations for the 10 periods yield:

  • Linear Regression: y = a + bx
  • Slope: 82.67
  • Intercept: 10,472.33
  • Coefficient of determination: 0.535

Forecasting is needed for quarters 3 and 4 in 2019 and quarters 1 and 2 in 2020. There is a debate about using data from all 10 periods versus only the last 5. Analysis for the last five periods includes:

Results of last five periods‟ observations

(Note: y values are scaled down by 100 for ease of calculation.)

Required:
a. Forecast sales for the four quarters using the 10-period data. (8 Marks)
b. Prepare similar forecasts using the last five periods of data. (8 Marks)
c. Evaluate which data set provides the better forecast. (4 Marks)

Login or create a free account to see answers

Find Related Questions by Tags, levels, etc.

Report an error

You're reporting an error for "PM – May 2021 – L2 – Q3 – Cost-Volume-Profit (CVP) Analysis"

PM – May 2024 – L2 – SB – Q4 – Environmental and Social Performance Management

Forecast sales with seasonality adjustments and regression analysis to produce cash forecasts.

Some time ago Robert launched a new product. At first, sales were good, but now the figures are causing concern. Robert wants a more accurate sales forecast to produce detailed cash forecasts.

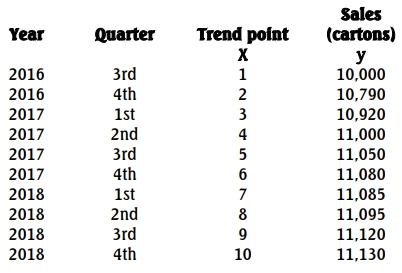
Since there is some seasonality present in the raw data, the series for sales shown below represents the underlying trend based on an averaging process:

On average, quarters 1 and 3 are 5% and 6% respectively above trend, while quarters 2 and 4 are respectively 2% and 9% below trend.

Some preliminary calculations on the above ten observations have been carried out and the results are summarized below:

Required:
a. Forecast the sales for the next two years, adjusting for seasonality. (12 Marks)
b. Discuss the importance of seasonality adjustments in sales forecasting. (4 Marks)
c. Explain how Robert could use the sales forecasts to produce detailed cash forecasts. (4 Marks)

Login or create a free account to see answers

Find Related Questions by Tags, levels, etc.
Report an error

You're reporting an error for "PM – May 2024 – L2 – SB – Q4 – Environmental and Social Performance Management"

PM – May 2021 – L2 – Q3 – Cost-Volume-Profit (CVP) Analysis

Forecast future sales using historical data and analyze which data period provides a better basis for forecasting.

Some time ago, Robert launched a new product. Initially, sales were strong, but recent figures have raised concerns. Robert seeks a more accurate sales forecast to create detailed cash projections. The sales data below illustrates an underlying trend derived from an averaging method:

Year Quarter Trend Point (x) Sales (Cartons) (y)
2016 3rd 1 10,000
2016 4th 2 10,760
2017 1st 3 10,920
2017 2nd 4 11,000
2017 3rd 5 11,050
2017 4th 6 11,080
2018 1st 7 11,085
2018 2nd 8 11,095
2018 3rd 9 11,120
2018 4th 10 11,130

On average, quarters 1 and 3 are 5% and 6% above the trend, respectively, while quarters 2 and 4 are 2% and 9% below it. Preliminary calculations for the 10 periods yield:

  • Linear Regression: y = a + bx
  • Slope: 82.67
  • Intercept: 10,472.33
  • Coefficient of determination: 0.535

Forecasting is needed for quarters 3 and 4 in 2019 and quarters 1 and 2 in 2020. There is a debate about using data from all 10 periods versus only the last 5. Analysis for the last five periods includes:

Results of last five periods‟ observations

(Note: y values are scaled down by 100 for ease of calculation.)

Required:
a. Forecast sales for the four quarters using the 10-period data. (8 Marks)
b. Prepare similar forecasts using the last five periods of data. (8 Marks)
c. Evaluate which data set provides the better forecast. (4 Marks)

Login or create a free account to see answers

Find Related Questions by Tags, levels, etc.

Report an error

You're reporting an error for "PM – May 2021 – L2 – Q3 – Cost-Volume-Profit (CVP) Analysis"

PM – May 2024 – L2 – SB – Q4 – Environmental and Social Performance Management

Forecast sales with seasonality adjustments and regression analysis to produce cash forecasts.

Some time ago Robert launched a new product. At first, sales were good, but now the figures are causing concern. Robert wants a more accurate sales forecast to produce detailed cash forecasts.

Since there is some seasonality present in the raw data, the series for sales shown below represents the underlying trend based on an averaging process:

On average, quarters 1 and 3 are 5% and 6% respectively above trend, while quarters 2 and 4 are respectively 2% and 9% below trend.

Some preliminary calculations on the above ten observations have been carried out and the results are summarized below:

Required:
a. Forecast the sales for the next two years, adjusting for seasonality. (12 Marks)
b. Discuss the importance of seasonality adjustments in sales forecasting. (4 Marks)
c. Explain how Robert could use the sales forecasts to produce detailed cash forecasts. (4 Marks)

Login or create a free account to see answers

Find Related Questions by Tags, levels, etc.

Report an error

You're reporting an error for "PM – May 2024 – L2 – SB – Q4 – Environmental and Social Performance Management"

error: Content is protected !!
Oops!

This feature is only available in selected plans.

Click on the login button below to login if you’re already subscribed to a plan or click on the upgrade button below to upgrade your current plan.

If you’re not subscribed to a plan, click on the button below to choose a plan