Question Tag: Seasonal Variations

Search 500 + past questions and counting.
  • Filter by Professional Bodies

  • Filter by Subject

  • Filter by Series

  • Filter by Topics

  • Filter by Levels

PM – Nov 2021 – L2 – Q4 – Performance Measurement Systems

Adjust sales for seasonal variations and discuss deseasonalised data, along with the challenges of participative budgeting.

You work as the assistant to the management accountant for Henry Limited, a medium-sized manufacturing company. One of its products, Product P, has been very successful in recent years, showing a steadily increasing trend in sales volumes. Sales volumes for the four quarters of last year were as follows:

Quarter 1 2 3 4
Actual sales volume (units) 420,000 450,000 475,000 475,000

A new assistant has recently joined the marketing department and she has asked you for help in understanding the terminology used in preparing sales forecasts and analysing sales trends. She said: “My main problem is that I do not see why my boss is so enthusiastic about the growth in Product P’s sales volume. It looks to me as though the rate of growth is really slowing down and has actually stopped in quarter 4. I am told that I should be looking at the deseasonalised or seasonally adjusted sales data, but I do not understand what is meant by this.”

You have found that Product P’s sales are subject to the following seasonal variations:

Quarter 1 2 3 4
Seasonal variation (units) +25,000 +15,000 0 -40,000

Required:
a.
i. Adjust for the seasonal variations to calculate deseasonalised or seasonally adjusted sales volume (i.e., the trend figures) for each quarter of last year. (5 Marks)
ii. Assuming that the trend and seasonal variations will continue, forecast the sales volumes for each of the four quarters of next year. (4 Marks)

b. Explain what is meant by seasonal variations and deseasonalised or seasonally adjusted data. Indicate how they can be useful in analysing a time series and preparing forecasts. (5 Marks)

c. State the arguments for and challenges arising from managers participating in setting their budget targets. (6 Marks)

Login or create a free account to see answers

Find Related Questions by Tags, levels, etc.

Report an error

You're reporting an error for "PM – Nov 2021 – L2 – Q4 – Performance Measurement Systems"

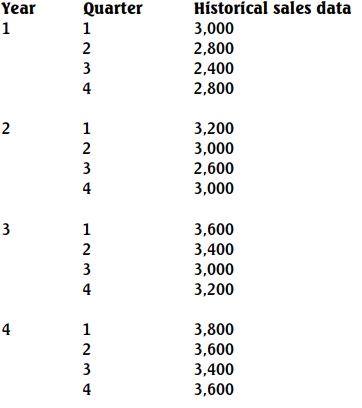
MI – Nov 2023 – L1 – SB – Q3 – Forecasting Techniques

Calculation of moving averages, trends, and seasonal variations based on four years of historical sales data.

The figures given below are four years’ historical sales data of a company.

Required:
Calculate the moving averages, trends, and seasonal variations.

Login or create a free account to see answers

Find Related Questions by Tags, levels, etc.
Report an error

You're reporting an error for "MI – Nov 2023 – L1 – SB – Q3 – Forecasting Techniques"

QT – Nov 2016 – L1 – Q7 – Forecasting

Analyze absenteeism trends using time series and forecasting techniques for Dropper Ltd.

The personnel department of Dropper Ltd, a large cocoa processing company in DropperLand, is concerned about absenteeism among its shop floor workforce. The mean number of absentees per day for each quarter of the years 1999 to 2001 and Quarter 1 in 2002 is given in the table below:

Q1 Q2 Q3 Q4
1999 25.10 14.40 9.50 23.70
2000 27.90 16.90 12.40 26.10
2001 31.40 19.70 15.90 29.90
2002 34.50

Required:
a) Plot the data on a graph, leaving space for the remaining 2002 figures. (3 marks)

b) Using the method of 2-quarterly centered moving averages,
i) Determine the trend in the series and superimpose this on your graph in (a). (4 marks)
ii) Determine the equation of the trend line above by considering only the first and last centered moving average value on your graph in (i). (3 marks)

c) Using an appropriate decomposition model, determine the seasonal variations in the data. Give reasons for your choice of model. (5 marks)

d) Use your analysis above to roughly forecast the mean number of absentees for the remaining quarters of 2002. Comment on your forecast. (5 marks)

Login or create a free account to see answers

Find Related Questions by Tags, levels, etc.

Report an error

You're reporting an error for "QT – Nov 2016 – L1 – Q7 – Forecasting"

QT – May 2018 – L1 – Q4 – Forecasting

Calculate centered moving averages, seasonal variations, and forecast sales using the multiplicative model.

a) The quarterly unit sales of electronic items of a retail company for the last three years are as follows:

Year Quarter 1 Quarter 2 Quarter 3 Quarter 4
2013 100 115 70 210
2014 120 165 100 220
2015 150 195 120 270

Required:
i) Calculate a centered three-moving average of the unit sales. (3 marks)
ii) Calculate the trend using a centered four-quarterly moving average. (4 marks)
iii) Calculate the four seasonal variations using (ii) and the multiplicative model. (7 marks)
iv) Forecast the number of unit sales for the year 2016 using the multiplicative model. (4 marks)
v) Comment on your answer in (iv). (2 marks)

Login or create a free account to see answers

Find Related Questions by Tags, levels, etc.

Report an error

You're reporting an error for "QT – May 2018 – L1 – Q4 – Forecasting"

IMAC – Nov 2021 – L1 – Q5 – Budgeting | Forecasting

Analysis of a regression equation related to absenteeism, seasonal variation in production output, and variance analysis for overheads.

a) A large manufacturing company is investigating the cost of sickness amongst production workers who the company has employed for more than one year. The following regression equation, based on a random sample of 50 for such production workers, was derived for 2018:

y=15.6−1.2xy = 15.6 – 1.2x

where yy represents the number of days absent in a year because of sickness and xx represents the number of years’ employment with the company.

Required: i) Explain the meaning of each component of the regression equation. (2 marks)
ii) Predict the number of days of absence through sickness to be expected of an employee who has been with the company for eight years. (2 marks)
iii) Explain TWO (2) limitations or problems of using this equation in practice. (4 marks)

b) A statistician is carrying out an analysis of a company’s production output. The output varies according to the year’s season, and, from the data, she has calculated the following seasonal variations in units of production:

QUARTER 1 2 3 4
Year 1 +11.2 +23.5
Year 2 -9.8 -28.1 +12.5 +23.7
Year 3 -7.4 -26.3 +11.7

Required: i) Calculate and explain the average quarterly variation for each quarter. (5 marks)
ii) If the trend output in the 4th Quarter of Year 3 is expected to be 10,536 units, what is the forecast output? (2 marks)

c) KK Ltd operates a standard absorption costing system and has provided the following costs data in relation to its prime product, Qwikpass:

Standard Cost Card:

GH¢
Direct Material 4kg @ GH¢3/kg 12
Direct Labour 3hrs @ GH¢5/hr 15
Variable Overheads 3hrs @ GH¢3/hr 9
Fixed Overheads 3hrs @ GH¢2 6
Total Cost per Unit 42

Budgeted Units: 6,000

Actual Results:

GH¢
Units produced 6,400
Direct Materials Purchased and used 32,000kg 144,000
Direct Labour 30,720hrs 199,680
Variable Overheads 138,240
Fixed Overheads 45,000
Total costs 526,920

Required: i) Compute the Variable Overheads Expenditure Variance. (1 mark)
ii) Compute the Fixed Overheads Expenditure Variance. (2 marks)
iii) Compute the Fixed Overheads Volume Variance. (2 marks)

Login or create a free account to see answers

Find Related Questions by Tags, levels, etc.

Report an error

You're reporting an error for "IMAC – Nov 2021 – L1 – Q5 – Budgeting | Forecasting"

IMAC – MAY 2021 – L1 – Q5 – Cost Segregation and Estimation | Forecasting | Standard Costing and Variance Analysis

Apportionment of service center costs to production departments and calculation of direct materials price variance.

a) A company is preparing its annual budget and it is estimating the number of units of Product W that would be sold in each quarter of year 2. Past experience has shown that the trend for sales of the product is represented by the following relationship:

y = a + bx where: y = quantity of sales units in the quarter a = 15,000 b = 3,000 x = the quarter number where 1 = quarter 1 of year 1

Actual sales of Product W in year 1 were affected by seasonal variations and were as follows:

Quarter Actual Sales Units
1 20,250
2 19,425
3 25,200
4 24,300

Required: Calculate the expected unit sales of Product W for each quarter of year 2, after adjusting for seasonal variations using the multiplicative model. (6 marks)

b) The records of direct labour hours and total factory overhead cost of Cooper Limited over the first six months of its operations are given below:

Month Direct Labour Hours Total Factory Overheads (GH¢000)
September 50,000 14,800
October 80,000 17,000
November 120,000 23,800
December 40,000 11,900
January 100,000 22,100
February 60,000 16,150

Management is interested in distinguishing between the fixed and variable portions of the overheads.

Required: Using the least square regression method, estimate the variable cost per direct labour hour and the total fixed cost per month. (9 marks)

c) State and explain the methods used in setting: i) Direct Material Cost Standard. (2.5 marks) ii) Direct Labour Cost Standard. (2.5 marks)

Login or create a free account to see answers

Find Related Questions by Tags, levels, etc.

Report an error

You're reporting an error for "IMAC – MAY 2021 – L1 – Q5 – Cost Segregation and Estimation | Forecasting | Standard Costing and Variance Analysis"

error: Content is protected !!
Oops!

This feature is only available in selected plans.

Click on the login button below to login if you’re already subscribed to a plan or click on the upgrade button below to upgrade your current plan.

If you’re not subscribed to a plan, click on the button below to choose a plan