Question Tag: Regression

Search 500 + past questions and counting.
  • Filter by Professional Bodies

  • Filter by Subject

  • Filter by Series

  • Filter by Topics

  • Filter by Levels

PM – May 2024 – L2 – SB – Q4 – Environmental and Social Performance Management

Forecast sales with seasonality adjustments and regression analysis to produce cash forecasts.

Some time ago Robert launched a new product. At first, sales were good, but now the figures are causing concern. Robert wants a more accurate sales forecast to produce detailed cash forecasts.

Since there is some seasonality present in the raw data, the series for sales shown below represents the underlying trend based on an averaging process:
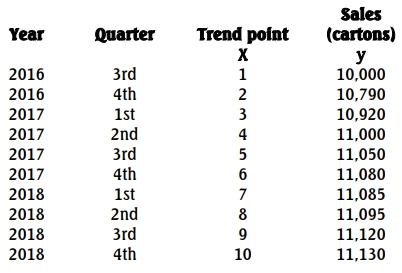
On average, quarters 1 and 3 are 5% and 6% respectively above trend, while quarters 2 and 4 are respectively 2% and 9% below trend.

Some preliminary calculations on the above ten observations have been carried out and the results are summarized below:

Required:
a. Forecast the sales for the next two years, adjusting for seasonality. (12 Marks)
b. Discuss the importance of seasonality adjustments in sales forecasting. (4 Marks)
c. Explain how Robert could use the sales forecasts to produce detailed cash forecasts. (4 Marks)

Login or create a free account to see answers

Find Related Questions by Tags, levels, etc.

Report an error

You're reporting an error for "PM – May 2024 – L2 – SB – Q4 – Environmental and Social Performance Management"

QTB – MAY 2016 – L1 – SA – Q16 – Statistics

Identify the statistical measure used to determine the degree of association between variables

Which of the following is used to measure the degree of association between two variables?

A. Regression

B. Percentiles

C. Quartiles

D. Correlation E. Coefficient of variation

Login or create a free account to see answers

Find Related Questions by Tags, levels, etc.

Report an error

You're reporting an error for "QTB – MAY 2016 – L1 – SA – Q16 – Statistics"

QTB – May 2015 – L1 – SA – Q9 – Statistics

Identifying the dependent and independent variables in regression analysis.

A sales manager of a manufacturing company is to predict the sales of some products for given expenditures on advertising using a simple linear regression analysis. In the fitted regression equation, the sales and advertising expenditure are respectively ____________ and ________________ variables.

A. Independent, dependent
B. Dependent, independent
C. Fixed, dependent
D. Dependent, fixed
E. Nominal, categorical

Login or create a free account to see answers

Find Related Questions by Tags, levels, etc.

Report an error

You're reporting an error for "QTB – May 2015 – L1 – SA – Q9 – Statistics"

QT – Nov 2016 – L1 – Q3 – Forecasting

Derive a regression forecasting equation for iron rod demand based on construction permits and analyze the results.

The Branch Manager of a building material production plant feels that the demand for iron rod shipments may be related to the number of construction permits issued in the country during the previous quarter. The Manager has collected the data shown in the table below:

Construction Permits Iron Rods
15 6
9 4
40 16
20 6
25 13
25 9
15 10
35 16

Required:

i) Use the normal equations of the least square regression method to derive a regression forecasting equation for the data. (9 marks)
ii) Interpret your regression coefficient in (i) above. (1 mark)
iii) Using the regression line in (a) above, determine a point estimate for Iron Rods when the number of construction permits is 30. (2 marks)
iv) Is your estimate in (iii) above reliable? Give reason(s) for your answer. (2 marks)
v) Calculate the coefficient of determination and interpret it. (6 marks)

Login or create a free account to see answers

Find Related Questions by Tags, levels, etc.

Report an error

You're reporting an error for "QT – Nov 2016 – L1 – Q3 – Forecasting"

QT – May 2018 – L1 – Q2 – Forecasting

Develop a regression model for energy consumption based on temperature and calculate the standard error of estimate.

A Ghanaian student studying abroad wants to develop an empirical model for energy consumption (in kilowatts per day) as a function of the daily high temperature (in degrees Celsius) in winter. For nine days the following information was obtained:

Temperature (°C) -0.4 -0.2 0.3 0.8 1.1 1.4 1.8 2.1 2.5
Energy used (kW) 28 30 26 25 26 26 27 26 22

Required:
a) Identify the response and predictor variables, based on the purpose for developing the regression model. (2 marks)
b) Determine the coefficient of regression and the regression constant. Give your values to 2 decimal places. (5 marks)
c) Interpret your results in b) above. (3 marks)
d) Write the equation of the regression line of energy use on temperature in the form y=a+bxy = a + bx. (2 marks)
e) Estimate the student’s daily energy consumption when the daily high temperature is 2 degrees Celsius. (2 marks)
f) Determine the standard error of estimate. (6 marks)

Login or create a free account to see answers

Find Related Questions by Tags, levels, etc.

Report an error

You're reporting an error for "QT – May 2018 – L1 – Q2 – Forecasting"

QT – Nov 2018 – L1 – Q1a – Forecasting

Explain the term coefficient of correlation in forecasting.

Explain the term Coefficient of Correlation in forecasting.

Login or create a free account to see answers

Find Related Questions by Tags, levels, etc.

Report an error

You're reporting an error for "QT – Nov 2018 – L1 – Q1a – Forecasting"

error: Content is protected !!
Oops!

This feature is only available in selected plans.

Click on the login button below to login if you’re already subscribed to a plan or click on the upgrade button below to upgrade your current plan.

If you’re not subscribed to a plan, click on the button below to choose a plan