- 14 Marks
CR – Nov 2024 – L3 – Q5b – Financial Performance & Digital Technology Integration
Evaluating the financial performance of Nsawkaw PLC and addressing challenges of digital technology integration in accounting.
Question
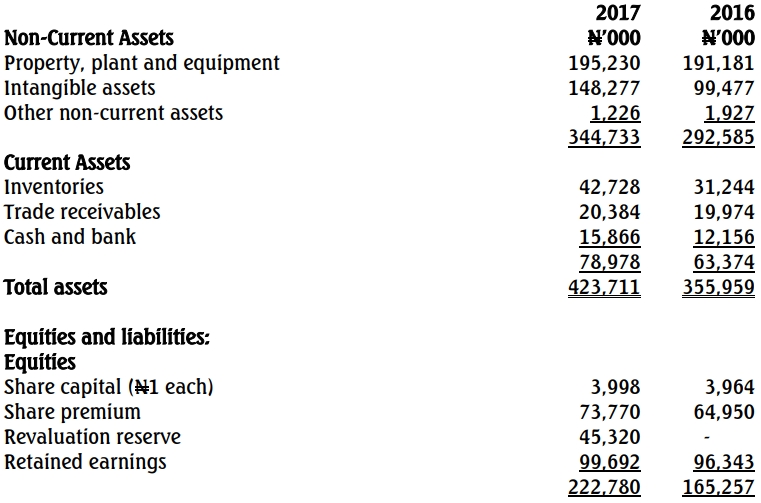
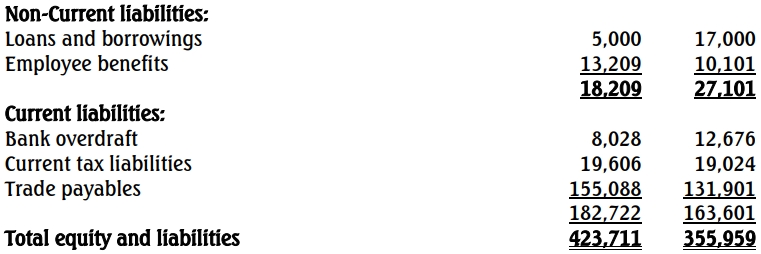
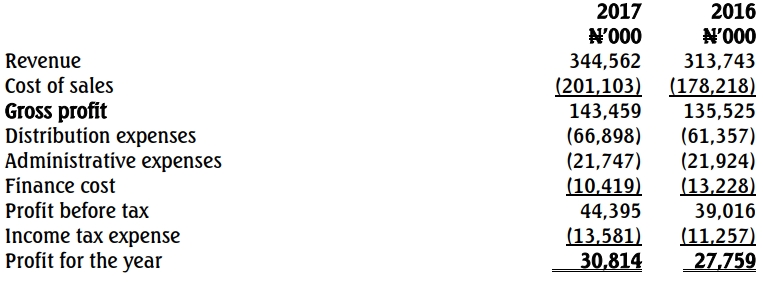
(a) Compute the following ratios for the years ended 2024 & 2023:
i) Operating profit margin
ii) Return on parent’s equity
iii) Earnings per share
iv) Current ratio
v) Trade receivables days
vi) Total liabilities to total assets %
(b) Write a report to the directors of DPEF evaluating the inter-period financial performance and position of NK using the above six (6) ratios. The report should draw attention to how the non-financial metrics combine with the financial counterparts to showcase the prospects and viability of NK. c) The concept of double materiality is relevant to sustainability impacts and dependencies. It
incorporates financial materiality and impact materiality.
Find Related Questions by Tags, levels, etc.
- Tags: Compliance, Cybersecurity, Digital Transformation, Ethics, Financial Analysis, Ratio Analysis
- Level: Level 3