Question Tag: Profitability Ratios

Search 500 + past questions and counting.
  • Filter by Professional Bodies

  • Filter by Subject

  • Filter by Series

  • Filter by Topics

  • Filter by Levels

CR – Dec 2020 – L3 – Q2 – Presentation of Financial Statements (IAS 1)

Assess the performance of two companies using financial ratios and draft a report for investment decisions.

Heritage Limited and Legacy Limited are two competitors in the merchandising and retailing sector of the economy. At a time when the sector is faced with escalating fuel prices and economic recession, both companies have shown resilience and adaptability. The financial statements of the companies for the year ended December 31, 2020, are as follows:

Statements of Profit or Loss for the Year Ended December 31, 2020:

Item Heritage Limited (N’000) Legacy Limited (N’000)
Revenue 150,000 700,000
Cost of Sales (60,000) (210,000)
Gross Profit 90,000 490,000
Interest 500 12,000
Distribution Costs 13,000 72,000
Administrative Expenses 15,000 35,000
Total Expenses 28,500 119,000
Profit Before Tax 61,500 371,000
Income Tax Expense (16,605) (100,170)
Profit for the Year 44,895 270,830

Statements of Financial Position as at December 31, 2020:

Item Heritage Limited (N’000) Legacy Limited (N’000)
Assets:
Non-Current Assets:
Property 500,000
Plant and Equipment 190,000 280,000
Total Non-Current Assets 190,000 780,000
Current Assets:
Inventories 12,000 26,250
Trade Receivables 37,500 105,000
Bank 500 22,000
Total Current Assets 50,000 153,250
Total Assets 240,000 933,250
Equity & Liabilities:
Equity:
Share Capital 156,000 174,750
Retained Earnings 51,395 390,830
Total Equity 207,395 565,580
Non-Current Liabilities:
Long-Term Debt 10,000 250,000
Current Liabilities:
Trade Payables 22,605 117,670
Total Liabilities 32,605 367,670
Total Equity & Liabilities 240,000 933,250

The Board of Directors of Patrimony Investments PLC is considering a proposal to buy into one of the companies to enhance the reported profit and stability of the company after the investment.

Required:

a. Assess the relative performance of the two companies for the year ended December 31, 2020, with three suitable ratios each for:

  • Profitability and efficiency
  • Liquidity and solvency
    (8 Marks)

b. Draft a report on the computed ratios for the consideration of the Board of Directors of Patrimony Investments PLC to appropriately guide the Board in deciding on the proposal to buy into any one of the companies.
(12 Marks)

Login or create a free account to see answers

Find Related Questions by Tags, levels, etc.

Report an error

You're reporting an error for "CR – Dec 2020 – L3 – Q2 – Presentation of Financial Statements (IAS 1)"

CR – May 2023 – L3 – Q2a – Provisions, Contingent Liabilities, and Contingent Assets (IAS 37)

Analyze Octopus Petroleum’s performance and ability to finance future oil spill costs

Octopus Petroleum PLC is a multinational oil and gas group operating in the Niger Delta areas of Nigeria. The company has been highly profitable over the years. The group explores and extracts natural resources, holds reserves, and has recently become involved in the downstream sector by opening various commercial retail outlets for the sale of petrol to motorists.

In June 2020, the company was involved in an ecological disaster in the Ogoni area of Niger Delta as a result of massive oil spillage due to some technical faults, thereby resulting in spilling oil into the surrounding ocean and damaging wildlife and local communities.

Investors are concerned about the future prospects of Octopus Petroleum PLC and whether it represents a safe investment since the company normally operates in the lucrative oil and gas sector.

Octopus Petroleum Group annual report for the year 2020 and its comparative figures are shown below:

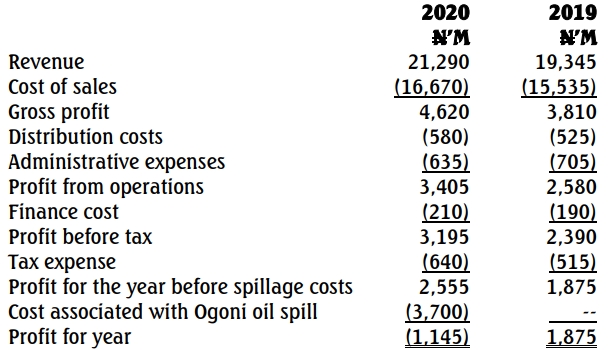
Octopus Petroleum Group Consolidated Statement of Profit or Loss for the Year Ended December 31

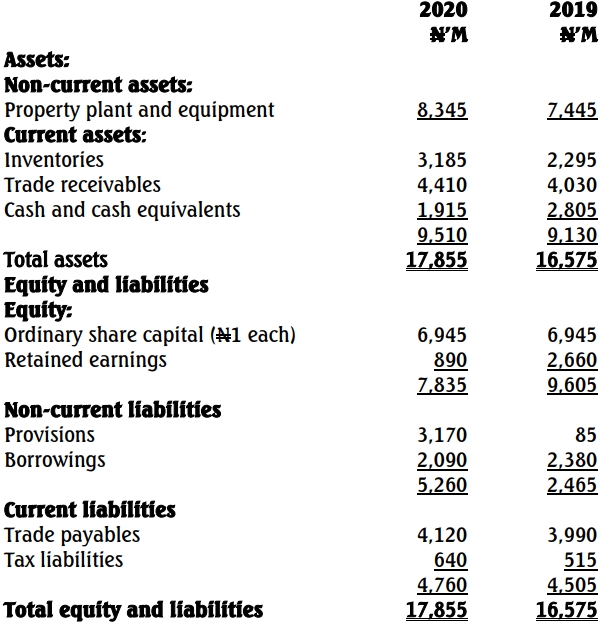
Octopus Petroleum Group Consolidated Statement of Financial Position as at December 31

Additional Information:

  1. The N3,700 million provision for the Ogoni oil spill is an estimated cost net of relevant tax.
  2. Calculating the financial cost of the oil spill in Ogoni land has been slightly problematic. However, N530 million had been expended by year-end, while the future costs of clean-up and compensation are undetermined.
  3. One uncertain cost is fines payable to the Federal Government of Nigeria. Past fines have exceeded N2,500 million.
  4. Octopus Petroleum Group vertically integrated in 2020 by acquiring and rebranding petrol stations.
  5. Oil reserves were at record-high levels in 2020.
  6. Oil prices increased by approximately 5% during 2020.
  7. The company values inventory on a last-in-first-out (LIFO) basis, which contravenes IAS 2.
  8. Dividend payments remained at N625 million for both 2020 and 2019.
  9. Investors typically evaluate companies using these ratios:
    • Profitability Ratios:
      • Return on Capital Employed (ROCE)
      • Return on Equity (ROE)
      • Gross Profit Percentage
      • Operating Profit Percentage
    • Liquidity Ratios:
      • Current Ratio
      • Acid Test Ratio
    • Resource Utilization and Financial Position Ratios:
      • Inventory Turnover
      • Asset Turnover
      • Interest Cover
      • Gearing Ratio

Required:

(a) Analyze the performance of Octopus Petroleum Group over the two-year period. Your analysis should also consider the group’s ability to finance the cost of the oil spill in Ogoni land in the coming years. (14 Marks)

Login or create a free account to see answers

Find Related Questions by Tags, levels, etc.
Report an error

You're reporting an error for "CR – May 2023 – L3 – Q2a – Provisions, Contingent Liabilities, and Contingent Assets (IAS 37)"

PM – Nov 2024 – L2 – Q7b – Divisional Performance Measurement

Evaluating division performance using ROI and residual income methods with adjusted cost of capital.

Ngerige and Sons Limited has four operating divisions spread across four cities in Nigeria: Lagos, Kano, Gombe, and Enugu. These divisions are treated as investment centres for performance reporting purposes. The following information is available:

Particulars Lagos Kano Gombe Enugu
Divisional Investment (N) 10,000,000 4,000,000 3,000,000 7,000,000
Divisional Sales (N) 53,000,000 23,000,000 24,600,000 29,400,000
Divisional Variable Costs (N) 50,000,000 22,000,000 23,400,000 27,400,000
Specific Fixed Costs (N) 1,500,000 750,000 600,000 800,000

The company’s annual general fixed cost is N1,300,000, apportioned to divisions based on sales. The cost of capital for Ngerige and Sons Limited is 7.5%. Ignore taxation.

Required:

i. Evaluate the performance of the divisions using the following methods:

  • ROI method. (3 Marks)
  • Residual Income Method. (3 Marks)

ii. Re-evaluate the residual income situation for the company given an adjusted cost of capital of 10%. (3 Marks)

Login or create a free account to see answers

Find Related Questions by Tags, levels, etc.
Report an error

You're reporting an error for "PM – Nov 2024 – L2 – Q7b – Divisional Performance Measurement"

FR – Nov 2020 – L2 – Q1b – Ethical Issues in Financial Reporting.

Analyze signs, causes, and solutions to overtrading at Ikoko Plc based on its financial statements.

Ikoko Plc started business 3 years ago following a research breakthrough that motivated large-scale customers to order the company’s new product.

The extract from the financial statements recently published is as follows:

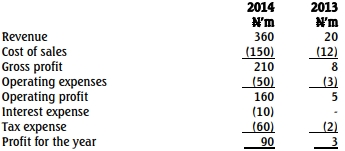
Statement of Profit or Loss for the Year Ended December 31, 2014


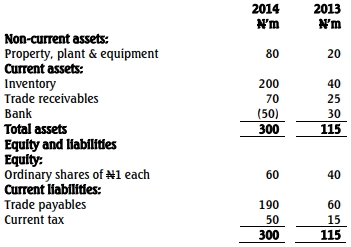
Statement of Financial Position as at December 31, 2014

Required:
i. Discuss THREE signs that show Ikoko Plc is suffering from overtrading during the year ended December 31, 2014, from the published financial statements. (5 marks)
ii. Identify any FIVE possible causes of the problem from the published financial statements. (5 marks)
iii. Recommend any FIVE possible solutions to the problem. (5 marks)

Login or create a free account to see answers

Find Related Questions by Tags, levels, etc.
Report an error

You're reporting an error for "FR – Nov 2020 – L2 – Q1b – Ethical Issues in Financial Reporting."

CR – Nov 2020 – L3 – Q5a – Return on Equity & Return on Capital Employed

Calculate and interpret return on equity and return on capital employed for Bounce Back Ltd for two years.

Bounce Back Ltd Financial Information:

Statement of Comprehensive Income for the year ended 30 November:

2019 2018
Profit before interest and tax GH¢2,200,000 GH¢1,570,000
Interest expense (GH¢170,000) (GH¢150,000)
Profit before tax GH¢2,030,000 GH¢1,420,000
Taxation (GH¢730,000) (GH¢520,000)
Profit after tax GH¢1,300,000 GH¢900,000
Dividends paid (GH¢250,000) (GH¢250,000)
Retained profit GH¢1,050,000 GH¢650,000

Statement of Financial Position as at 30 November:

2019 2018
Non-current assets (written-down value) GH¢6,350,000 GH¢5,600,000
Current assets
Trade receivables GH¢2,100,000 GH¢2,070,000
Inventories GH¢1,710,000 GH¢1,540,000
Total current assets GH¢3,810,000 GH¢3,610,000
Creditors: amounts due within one year
Trade payables GH¢1,040,000 GH¢1,130,000
Taxation GH¢550,000 GH¢450,000
Bank overdraft GH¢370,000 GH¢480,000
Total current liabilities GH¢1,960,000 GH¢2,060,000
Net current assets GH¢1,850,000 GH¢1,550,000
Total net assets GH¢8,200,000 GH¢7,150,000
Creditors: amounts due after more than one year
10% debentures GH¢1,500,000 GH¢1,500,000
Equity
Share capital (ordinary shares of 50p fully paid up) GH¢3,000,000 GH¢3,000,000
Retained earnings GH¢3,700,000 GH¢2,650,000
Total equity GH¢6,700,000 GH¢5,650,000
Total long-term liabilities and equity GH¢8,200,000 GH¢7,150,000

Required:

  1. Calculate, for both years, the return on equity and the return on capital employed.

Login or create a free account to see answers

Find Related Questions by Tags, levels, etc.
Report an error

You're reporting an error for "CR – Nov 2020 – L3 – Q5a – Return on Equity & Return on Capital Employed"

FR – May 2019 – L2 – Q3 – Statement of Cash Flows (IAS 7)

Calculation of cash operating cycle and comparative ratios for Kobape Limited, and analysis of company performance through a report.

Shown below are the financial statements of Kobape Limited for its most recent two years.

Extract from the statement of profit or loss for the year ended 30 April:

2019 (N’000) 2018 (N’000)
Revenue 224,000 195,000
Cost of sales (169,200) (136,500)
Gross profit 54,800 58,500
Administrative costs (32,700) (38,040)
Distribution costs (10,900) (12,680)
Finance cost (1,900) (1,380)
Profit before tax 9,300 6,400

Statement of financial position as at 30 April:

Assets (N’000) 2019 2018
Non-current assets 37,000 28,600
Current assets:
– Inventory 12,800 9,800
– Trade receivables 24,600 21,600
– Cash balance 1,600 2,400
Total assets 76,000 62,400

Equity and liabilities:

2019 2018
Ordinary share capital 16,000 16,000
Retained earnings 26,200 18,600
Non-current liabilities:
– 10% loan notes 16,000 12,000
Current liabilities:
– Bank overdraft 2,200 1,600
– Trade payables 15,000 13,800
– Taxation 600 400
Total equity and liabilities 76,000 62,400

The following are the ratios calculated for Kobape Limited based on the financial statements of the previous year and also the latest industry average ratios:

Ratio Kobape Ltd (30 April 2018) Industry Average
Net profit margin 3.99% 4.73%
ROCE (Capital employed = equity + loan notes) 16.69% 18.50%
Asset turnover 4.19 times 3.91 times
Current ratio 2.14:1 1.90:1
Quick ratio 1.52:1 1.27:1
Gross profit margin 30.0% 35.23%
Account receivables collection period 40 days 52 days
Account payables payment period 37 days 49 days
Inventory turnover (times) 13.9 times 18.3 times
Gearing ratio 25.75% 32.71%

Required:
a. Calculate the cash operating cycle of Kobape Limited for the year ended 30 April, 2018 and 2019. (5 Marks)

b. Calculate the comparative ratio(s) (to two decimal places where appropriate) for Kobape Limited for the year ended 30 April, 2019. (5 Marks)

c. Draft a report addressed to the board of directors of Kobape Limited, analyzing the performance of the company for the year 2019 based on the result of the previous year and the industry average. (10 Marks)

Login or create a free account to see answers

Find Related Questions by Tags, levels, etc.
Report an error

You're reporting an error for "FR – May 2019 – L2 – Q3 – Statement of Cash Flows (IAS 7)"

FR – May 2018 – L2 – Q4 – Consolidated Financial Statements (IFRS 10)

Assess the financial performance and position of two companies using specified ratios and explain the limitations of ratio analysis.

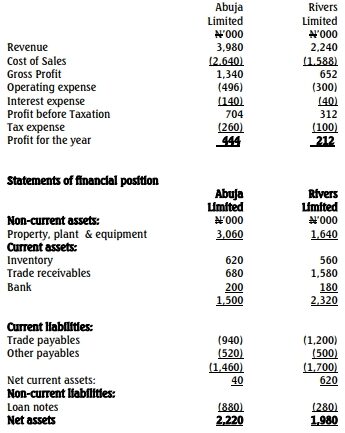
Ibadan Nigeria Limited is considering acquiring a suitable private limited liability company. The board of directors engaged a financial consultant to analyze the financial position of two companies, Abuja Limited and Rivers Limited, which are both receptive to the acquisition. The draft financial statements of the two companies are as follows:

Statements of Profit or Loss

a. Draft a report to the chairman of the board of directors of Ibadan Limited to assess the financial performance and position of the two companies using the following specific ratios: (12 Marks) i. Profitability ratios: Gross profit percentage and net profit margin. ii. Liquidity ratios: Acid test ratio, current ratio, trade receivable period. iii. Long-term financial stability ratios: Gearing ratio and proprietary ratio. iv. Efficiency ratios: Total asset turnover and non-current asset turnover.

b. Explain the limitations of ratio analysis and further information that may be useful to the board of directors when making the acquisition decision. (8 Marks)

Login or create a free account to see answers

Find Related Questions by Tags, levels, etc.

Report an error

You're reporting an error for "FR – May 2018 – L2 – Q4 – Consolidated Financial Statements (IFRS 10)"

FR – Nov 2023 – L2 – Q4a – Financial Statement Analysis

Calculate key financial ratios for Addin Petroleum and Gyan Petroleum to assess their performance for acquisition purposes.

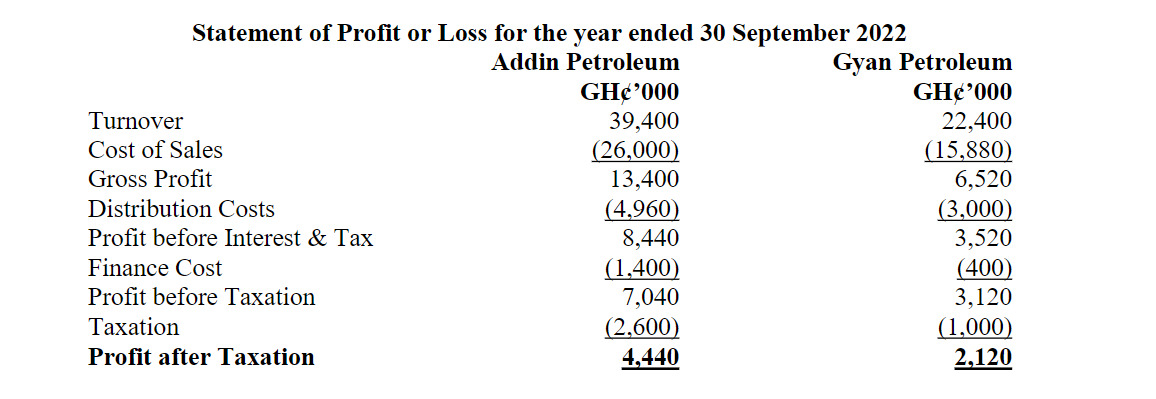
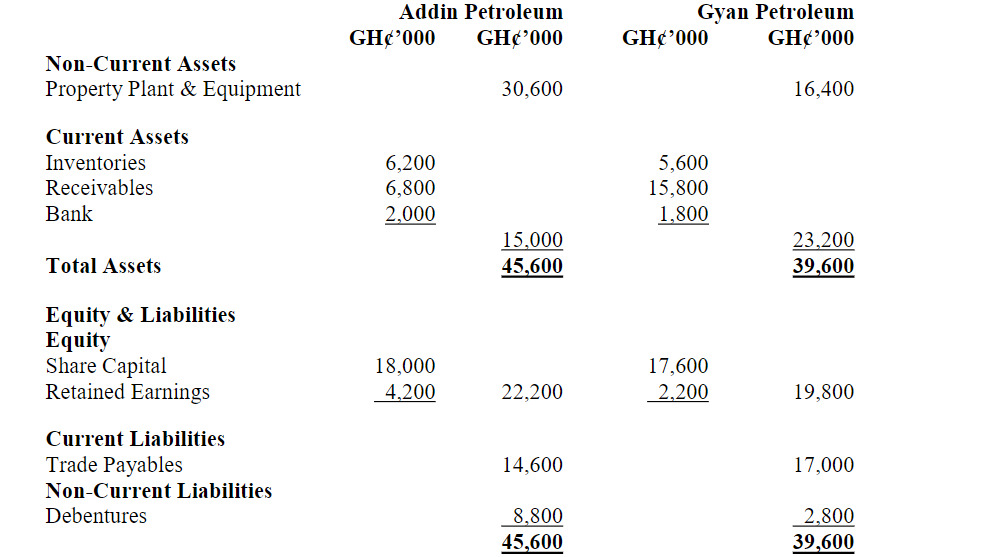
You are the Chief Finance Officer of LizOil Co. Ltd, a holding company with subsidiaries that have diversified interests. The company’s Board of Directors are interested in acquiring a new subsidiary in the Downstream Petroleum Sector. Two companies have been identified as potentials for the acquisitions: Addin Petroleum and Gyan Petroleum. The following are the summaries of their respective financial statements:

Statement of Profit or Loss for the year ended 30 September 2022

Statement of Financial Position as at 30 September 2022

Required:
a) Calculate the following ratios for each of the two companies: i) Net profit margin ii) Return on year-end capital employed iii) Quick ratio iv) Trade receivables’ collection period (in days) v) Gearing (debt over debt plus equity) vi) Interest cover (9 marks)

b) Write a report to the Chairperson of the board based on a comparable analysis of performance of both companies using the ratios computed in (a) above. (9 marks)
c) State TWO (2) limitations of ratios. (2 marks)

Login or create a free account to see answers

Find Related Questions by Tags, levels, etc.
Report an error

You're reporting an error for "FR – Nov 2023 – L2 – Q4a – Financial Statement Analysis"

FR – March 2024 – L2 – Q4a – Financial Statement Analysis

Calculate financial ratios for Mantemante Ltd and compare them with industry averages.

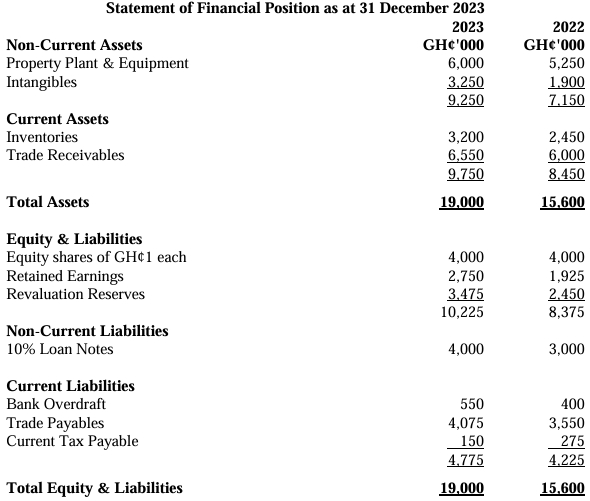
The following information has been extracted from the Financial Statements of Mantemante Ltd.

Statement of Financial Position as at 31 December 2023

Additional information, including ratios such as Return on Capital Employed, Net Profit Margin, Asset Turnover, Gearing, etc., is also provided.

Required:
a) Compute the comparable ratios for Mantemante Ltd for the years 2022 and 2023.
(10 marks)
b) Write a report for the Board of Directors analyzing the performance of Mantemante Ltd with references to the ratios for the two years and industry averages.
(10 marks)

Login or create a free account to see answers

Find Related Questions by Tags, levels, etc.
Report an error

You're reporting an error for "FR – March 2024 – L2 – Q4a – Financial Statement Analysis"

FR – Aug 2022 – L2 – Q4 – Financial Statement Analysis

Calculate various financial ratios for Pat Plc and compare them to industry averages and Write a report to assess the financial performance and position of Pat Plc relative to industry standards based on the calculated ratios.

Pat Plc is a listed Ghanaian company that produces textile prints for local and African markets. During the year ended 31 March 2022, the following financial information was available:

Gross profit: GH¢12,150
Cost of sales: GH¢77,850
Operating profit before interest and tax: GH¢7,130
Finance cost: GH¢920
Tax charged to profit or loss: GH¢1,400
Inventory turnover: 3.6 times
Dividend per share: GH¢0.36
Dividend yield: 6%

Extracts from the Statement of Financial Position as at 31 March 2022:

Required:
a. Based on the information provided, compute the following ratios for Pat Plc:
i) Profit (after tax) margin
ii) Current ratio
iii) Return on Capital Employed (ROCE)
iv) Receivables period
v) Price/Earnings ratio
vi) Debt/Equity ratio

b. Using the ratios computed in Question 4a, write a report to the Board of Directors of Pat Plc assessing the financial performance and financial position of the entity, relative to its industry.

Login or create a free account to see answers

Find Related Questions by Tags, levels, etc.
Report an error

You're reporting an error for "FR – Aug 2022 – L2 – Q4 – Financial Statement Analysis"

error: Content is protected !!
Oops!

This feature is only available in selected plans.

Click on the login button below to login if you’re already subscribed to a plan or click on the upgrade button below to upgrade your current plan.

If you’re not subscribed to a plan, click on the button below to choose a plan