Question Tag: Profitability

Search 500 + past questions and counting.
  • Filter by Professional Bodies

  • Filter by Subject

  • Filter by Series

  • Filter by Topics

  • Filter by Levels

CR – May 2020 – Q5 – Financial Performance and Position of Bossman Ltd

This question involves analyzing the financial performance and position of Bossman Ltd over three years using ratio analysis.

Login or create a free account to see answers

Find Related Questions by Tags, levels, etc.

Report an error

You're reporting an error for "CR – May 2020 – Q5 – Financial Performance and Position of Bossman Ltd"

CR – May 2021 – L3 – Q5 – Financial performance of Shop First Ltd

Analyze the financial performance of Shop First Ltd for 2020 and discuss the effects of discontinued operations and contingencies.

Shop First Ltd operates supermarket chains across the sixteen (16) regions of Ghana. The firm has been in commercial operation for more than two decades, growing its operations through an effective supply chain and financial management. However, in the last few years, keen competition and worsening general economic performance have steadied the consistent growths experienced over the years, resulting in the entity disposing off part of its operations. Below are the financial statements of Shop First Ltd:

Login or create a free account to see answers

Find Related Questions by Tags, levels, etc.

Report an error

You're reporting an error for "CR – May 2021 – L3 – Q5 – Financial performance of Shop First Ltd"

FR – May 2020 – L2 – Q4a – Financial Ratios Calculation

Calculate the financial ratios of Adenta Ltd for the year ended 31 December 2018 based on its financial statements.

Login or create a free account to see answers

Find Related Questions by Tags, levels, etc.

Report an error

You're reporting an error for "FR – May 2020 – L2 – Q4a – Financial Ratios Calculation"

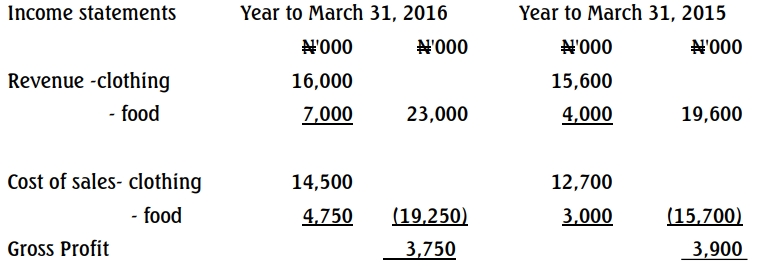
FR – May 2020 – L2 – Q4b – Financial Performance Analysis

Write a report analyzing Adenta Ltd's financial performance in comparison to industry averages for 2018.

As the Financial Controller of Adenta Ltd, write a report to the Board of Directors analyzing the financial performance of Adenta Ltd based on a comparison with the industry averages. (10 marks)


Login or create a free account to see answers

Find Related Questions by Tags, levels, etc.
Report an error

You're reporting an error for "FR – May 2020 – L2 – Q4b – Financial Performance Analysis"

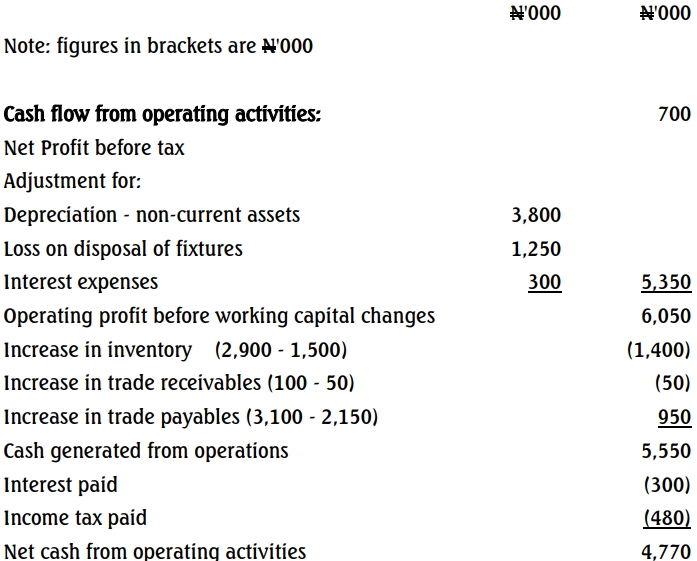
FR – Dec 2022 – L2 – Q4 – Financial Analysis & Ratios

Analyze and compare Madina Ltd.’s performance using key financial ratios for the years 2020 and 2021, including comparisons with industry standards.

Madina Ltd is engaged in the processing of palm fruits to produce palm oil and palm kernel oil. The financial statements of the company for the years ended 31st December 2020 and 2021 are as follows:

Statement of Profit or Loss for the year ended

Description 2021 (GH¢’000) 2020 (GH¢’000)
Revenue 123,817 95,620
Cost of sales (84,940) (76,240)
Net gains from changes in fair value of biological assets 84 754
Gross profit 38,961 20,134
Administrative expenses (11,727) (8,494)
Other income 1,267 927
Operating profit 28,501 12,567
Finance income 888 508
Profit before income tax 29,389 13,075
Income tax expense (4,692) (3,422)
Profit for the year 24,697 9,653

Statement of Financial Position as at:

Description 2021 (GH¢’000) 2020 (GH¢’000)
Non-current assets
Property, Plant & Equipment 57,909 49,471
Financial assets 5,221 5,137
Current assets
Inventories 8,490 9,370
Trade Receivables 24,663 18,304
Cash and cash equivalents 22,832 10,618
Total Assets 119,115 92,900

The following ratios have been gathered from the food and processing industry for the year ended 31 December 2021:

  • Return on Equity (%) 23.52
  • Gross Profit Margin (%) 29.57
  • Net Profit Margin (%) 22.16
  • Current Ratio (times) 2.5
  • Acid Test Ratio (times) 1.8
  • Inventory Turnover (days) 20
  • Trade Receivables Collection (days) 68
  • Trade Payables Settlement (days) 32

Required:
Write a report to the Board of Directors of Madina Ltd, assessing the company’s performance for the year ended 31 December 2021 in relation to the industry and the comparative year.

Login or create a free account to see answers

Find Related Questions by Tags, levels, etc.
Report an error

You're reporting an error for "FR – Dec 2022 – L2 – Q4 – Financial Analysis & Ratios"

FR – MAY 2021 – L2 – Q4a – Performance Analysis

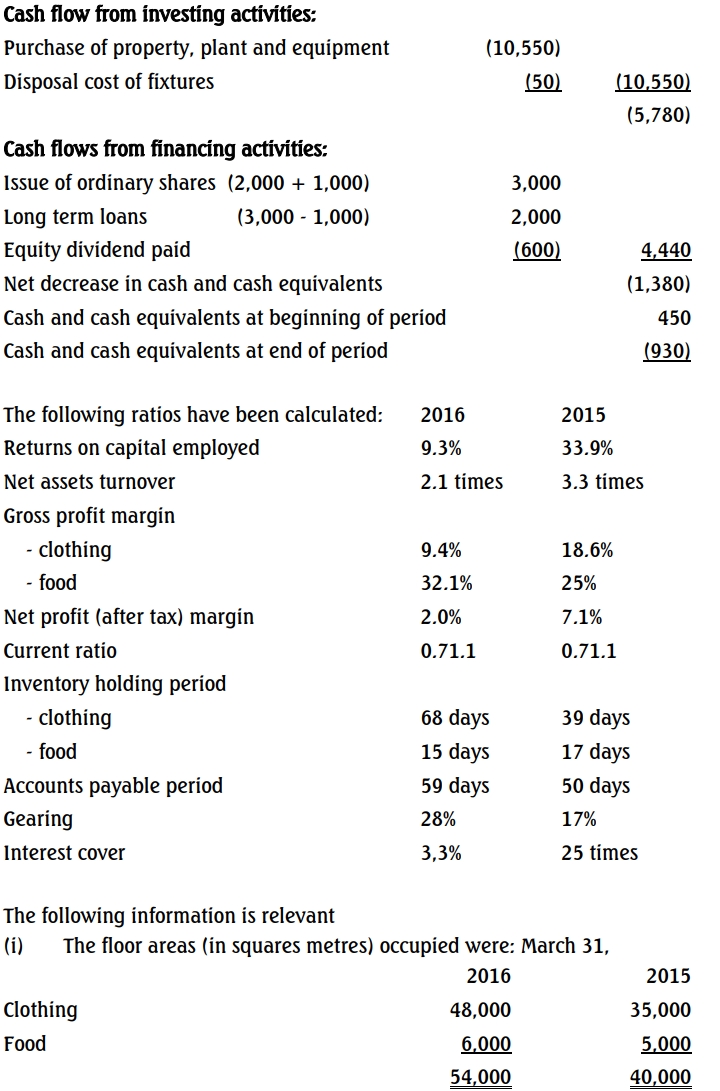
Analyze Zeus Ltd's performance and position from 2018 to 2020, including calculations.

You are the Financial Controller of Konka Ltd. Zeus Ltd is a competitor in the same industry, and it has been operating for 20 years. Summaries of Zeus Ltd’s statements of profit or loss and financial position for the previous three years are given below.

Summarised Statement of Profit or Loss For the year ended 31 December

2018 2019 2020
Revenue 840 981 913
Cost of sales (554) (645) (590)
Gross profit 286 336 323
Administration and selling expenses (186) (214) (219)
Profit before interest and taxes 100 122 104
Finance cost (6) (15) (19)
Profit before taxation 94 107 85
Taxation (45) (52) (45)
Profit after taxation 49 55 40
Dividends 24 24 24

Summarised Statement of Financial Position as at 31 December

2018 2019 2020
Assets
Non-current assets
Intangible assets 36 40 48
Tangible assets at net book value 176 206 216
Total Non-current assets 212 246 264
Current assets
Inventories 237 303 294
Receivables 105 141 160
Bank 52 58 52
Total Current Assets 394 502 506
Total Assets 606 748 770
Equity and Liabilities
Equity
Stated capital 100 100 100
Retained earnings 299 330 346
Total Equity 399 430 446
Non-current liabilities
Long-term loans 74 138 138
Current liabilities
Trade payables 53 75 75
Other payables 80 105 111
Total Current Liabilities 133 180 186
Total Equity and Liabilities 606 748 770

Required:
a) Analyzing the performance and position of Zeus Ltd and showing any calculations in an appendix to this report.
(15 marks)


Login or create a free account to see answers

Find Related Questions by Tags, levels, etc.
Report an error

You're reporting an error for "FR – MAY 2021 – L2 – Q4a – Performance Analysis"

PM – May 2019 – L2 – Q3 – Divisional Performance Measurement

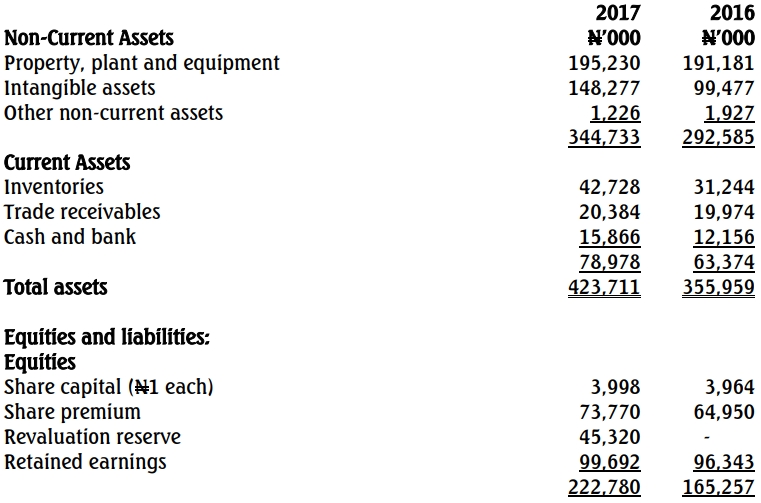
Calculate and analyze ROCE for Peterpan's subsidiaries and discuss performance excluding intra-group transactions.

Peterpan Nigeria Limited is a holding company with two subsidiaries manufacturing similar products in different regions of the country. These are Peterpan (Eastern) Nigeria Limited and Peterpan (Western) Nigeria Limited. Return on capital employed (ROCE) is used as the group’s performance measure and is also used to determine divisional managers’ bonuses. The results of the two companies and of the holding company for the year ended 31 December, 2018, and the statement of financial position as at that date are as follows:

Item Western (₦000) Eastern (₦000) Peterpan (₦000)
Revenue 400,000 440,000 792,941
Cost of sales (340,000) (330,000) (630,000)
Gross profit 60,000 110,000 162,941
Administrative costs (20,000) (60,000) (80,000)
Interest payable (20,000) (20,000)
Pre-tax profit 20,000 60,000 62,941

Non-current assets:

Item
Original cost 2,000,000 300,000 3,000,000
Accumulated depreciation (1,180,800) (320,000) (2,213,568)
Net book value 819,200 120,000 786,432
Net current assets 100,000 120,000 906,432
Total assets 919,200 906,432 1,825,632
Non-current borrowings 300,000 300,000
Shareholders’ fund 619,200 786,432 1,525,632
Capital employed 919,200 906,432 1,825,632

Additional Information:

  1. During the year, Eastern Limited sold goods to Western Limited that had cost Eastern Limited ₦20,000,000. The transactions relating to this sale have been eliminated from the holding company’s results stated above.
  2. Both companies use the same depreciation policy of 20% per annum on a reducing balance basis for their non-current assets. Neither company made any additions or disposals of non-current assets during the year.
  3. During the last board meeting of the holding company, it was decided that the holding company should impose a transfer pricing policy for transfers between the two subsidiaries.

Required:

a. Calculate the return on capital employed (ROCE) ratios for each of the two subsidiaries for the year and analyze these into their secondary ratio components of: i. Pre-Tax Profit % ii. Asset Turnover (3 Marks)

b. i. Calculate Eastern Limited’s gross profit margin on its internal sales and compare this to the gross profit margin on its external sales. (2 Marks)
ii. Discuss the performance of the two subsidiaries excluding the effects of the intra-group transactions. (9 Marks)

c. Explain THREE factors that management should consider when setting the transfer pricing policy. (6 Marks)
(Total 20 Marks)

Login or create a free account to see answers

Find Related Questions by Tags, levels, etc.
Report an error

You're reporting an error for "PM – May 2019 – L2 – Q3 – Divisional Performance Measurement"

PM – Nov 2018 – L2 – Q3 – Working Capital Management

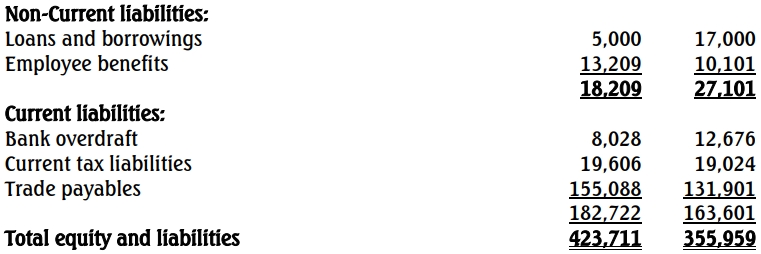
Prepare cash forecast, profitability, and liquidity ratio for Omegboeji Nigeria Ltd from 2015-2017.

Omegboeji Nigeria Limited is a trading company that specialises in buying and selling of bulk oil. The company is financed by a capital base of N24 million inclusive of reserves in a mix of 30% and 70% of debt and equity respectively. The company has been in the trading business for the past six years and has consistently adhered to its corporate policy on sales, purchases, and inventory management.

The company’s policy on sales is to ensure that sales proceeds are collected as follows:
(i) Cash Sales is 30% of the monthly sales.
(ii) The balance of the month’s sales is to be collected in the month following sales.

The policy on monthly purchases, which is in agreement with the supplier’s policy, is to pay for all supplies in the month following the month of purchase. The general policy of the company is that purchase cost for bulk oil represents 60% of the corresponding annual sales value while its inventory policy is to reserve 30% of the month’s purchases as closing inventory.

The following information is available for the five years 2013 to 2017:

Year Monthly Sales (N’000) Monthly Salaries (N’000) Monthly Rent (N’000) Monthly Expenses (N’000)
2013 12,000 800 400 350
2014 15,000 800 400 370
2015 16,800 960 400 390
2016 18,000 960 400 390
2017 24,000 1,080 400 380

Additional information:
(i) The company will purchase a motor vehicle in July 2016, which will be paid for in two instalments as follows:

  • First payment: 60% of cost in September 2016
  • Balance: To be paid in November 2016
    The cost of the motor vehicle is expected to be N7,500,000.

(ii)Annual depreciation for the motor vehicle will be 20% on a straight-line basis. Monthly expenses include annual depreciation for the motor vehicle.

(iii) The cash balance as of December 31, 2014, was N2,500,000.

(iv) The company’s salaries, rent, and expenses will be paid in the month during which they are due.

Required:
a. Prepare a cash forecast for 2015, 2016, and 2017, showing the closing cash balance at each year-end. (10 Marks)

b. Prepare a forecast profitability statement for 2015, 2016, and 2017. (7 Marks)

c. Determine and comment on the forecast liquidity ratio (current ratio) for 2017. (3 Marks)

Login or create a free account to see answers

Find Related Questions by Tags, levels, etc.
Report an error

You're reporting an error for "PM – Nov 2018 – L2 – Q3 – Working Capital Management"

FR – Nov 2018 – L2 – SB – Q4a and Q4b – Presentation of Financial Statements (IAS 1)

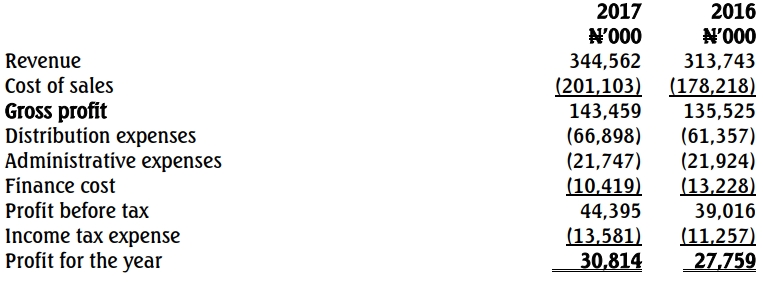
Calculate the financial ratios for Adebayo Trading Company Plc for the years 2018 and 2017 and comment on the profitability and short-term liquidity of Adebayo Trading Company Plc based on calculated ratios.

The following financial statements were extracted from the books of Adebayo Trading Company Plc for the relevant years:

Statement of Profit or Loss and Other Comprehensive Income for the year ended March 31:

Item 2018 (N’000) 2017 (N’000)
Revenue 250,000 400,000
Cost of sales (137,500) (225,000)
Gross profit 112,500 175,000
Administrative expenses (36,050) (44,500)
Distribution expenses (20,200) (24,250)
Finance cost (3,125) (3,125)
Profit before tax 53,125 103,125
Taxation expense (20,000) (40,000)
Profit for the year 33,125 63,125

Statement of Financial Position as at March 31:

Item 2018 (N’000) 2017 (N’000)
Non-current assets:
At cost 136,500 196,000
Accumulated depreciation (36,500) (52,250)
Net non-current assets 100,000 143,750
Current assets:
Inventory 79,250 20,750
Trade receivables 50,000 12,500
Bank balance 12,000 91,750
Total current assets 141,250 125,000
Equity and Liabilities:
Equity
Ordinary shares of 50 kobo each 57,500 57,500
Retained earnings 43,000 25,000
Total equity 100,500 82,500
Non-current liabilities:
10% Loan notes 31,250 31,250
12% Redeemable preference shares 5,000
Total non-current liabilities 31,250 36,250
Current liabilities:
Trade payables 18,750 26,875
Taxation 60,000 40,000
Bank overdraft 30,750 83,125
Total current liabilities 109,500 150,000
Total equity and liabilities 241,250 268,750

Additional Information:
(i) Dividend paid to Equity holders: N15,125,000 (2018) and N21,375,000 (2017).
(ii) Drop in market price per share: 36 kobo (2017) to 24 kobo (2018).
(iii) Finance cost relates to interest paid on 10% loan notes.

Required:
(a) Calculate in columnar form, for the two relevant years the following financial ratios:

  • Return on capital employed (ROCE)
  • Net profit margin (use profit after tax)
  • Current ratio
  • Quick ratio
  • Debt ratio
  • Fixed interest cover
  • Dividend cover
  • Dividend yield
    (12 Marks)

(b) Comment on the profitability and short-term liquidity of the company based on the ratios calculated.
(4 Marks)

Login or create a free account to see answers

Find Related Questions by Tags, levels, etc.
Report an error

You're reporting an error for "FR – Nov 2018 – L2 – SB – Q4a and Q4b – Presentation of Financial Statements (IAS 1)"

BMF – Nov 2019 – L1 – SB – Q2b – Investment Decisions

Explain limitations of financial objectives and ways to assess performance.

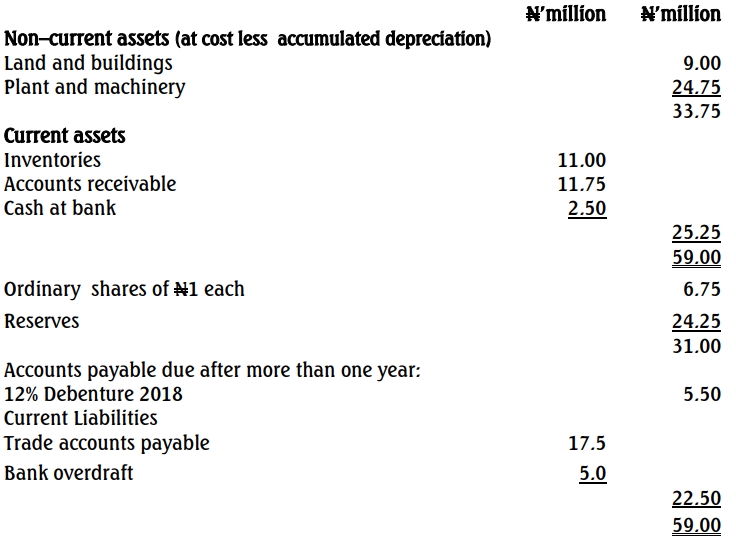
(b) THREE commonly-used financial objectives of a firm are to maximise shareholders’ wealth, profitability, and growth in earnings per share. However, these three objectives have some limitations hence the saying ‘no financial target on its own is ideal’.

(i) Explain the limitations of these THREE financial objectives of the firm. (6 Marks)
(ii) State and explain THREE ways by which financial performance of a firm might be assessed. (6 Marks)

Login or create a free account to see answers

Find Related Questions by Tags, levels, etc.
Report an error

You're reporting an error for "BMF – Nov 2019 – L1 – SB – Q2b – Investment Decisions"

Oops!

This feature is only available in selected plans.

Click on the login button below to login if you’re already subscribed to a plan or click on the upgrade button below to upgrade your current plan.

If you’re not subscribed to a plan, click on the button below to choose a plan