- 20 Marks
QTB – Nov 2014 – L1 – SB – Q3 – Operations Research
Calculate control levels for inventory, expected time for a project, and identify the critical path in a network diagram.
Question
a. Calculate the various control levels from the following data on a given inventory item:
- Normal usage: 1,600 per day
- Minimum usage: 1,000 per day
- Maximum usage: 3,000 per day
- Lead time: 16 – 20 days
- EOQ: 40,000
(9 Marks)
b. If the optimistic, most likely, and pessimistic times are given as 11 days, 15 days, and 18 days respectively, calculate the expected time of the project delivery.
(3 Marks)
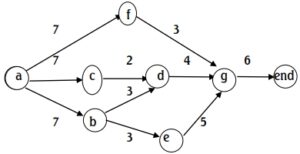
c. The network for a small building project is shown below together with the time in days required to complete each task.

Required:
i. List the possible paths together with their durations through the network. (6 Marks)
ii. State the critical path and the project duration. (2 Marks)
(Total: 20 Marks)
Find Related Questions by Tags, levels, etc.

