Question Tag: Current Ratio

Search 500 + past questions and counting.
  • Filter by Professional Bodies

  • Filter by Subject

  • Filter by Series

  • Filter by Topics

  • Filter by Levels

PM – Nov 2024 – L2 – Q6 – Divisional Performance Measurement

Comparative analysis of Owerri and Isiekenesi event centers based on financial performance metrics

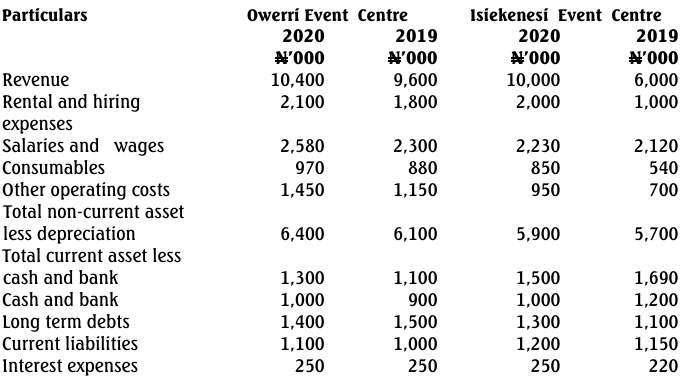
Omegboje and company is a medium-scale outfit that specializes in the rental business in Owerri and Isiekenesi towns. The company operates a large event center in each city, supplying chairs, tables, and canopies for both outdoor and some indoor events.

Each event center manager has some independence in operations and earns a performance bonus of 10% of sales if they achieve more than the standard return on capital employed (ROCE) of 50%.

The following financial data is available for the two centers for the years ending December 31, 2020, and 2019:

Additional Information:

  1. Revenue is derived from rentals and ancillary services.
  2. Both centers have a cost of capital of 15%.
  3. Ignore taxation and inflation.

Required:

a. Discuss the relative performance of the two centers based on: i. Return on Capital Employed (ROCE) ii. Residual Income iii. Profit Margin iv. Current Ratio v. Quick Ratio vi. Gearing Ratio vii. Interest Cover
(7 Marks)

b. Compute the performance bonus for the centers (if any), showing your workings.
(4 Marks)

c. Briefly outline the role of a Management Accountant in project management.
(4 Marks)

Login or create a free account to see answers

Find Related Questions by Tags, levels, etc.

Report an error

You're reporting an error for "PM – Nov 2024 – L2 – Q6 – Divisional Performance Measurement"

PM – Nov 2014 – L2 – Q3 – Divisional Performance Measurement

Compare financial performance of Purity Nigeria Ltd. and Benchmark Co. Ltd using key financial ratios and offer strategic improvement recommendations.

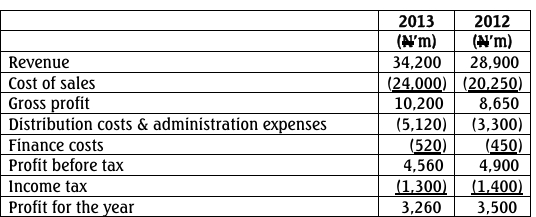
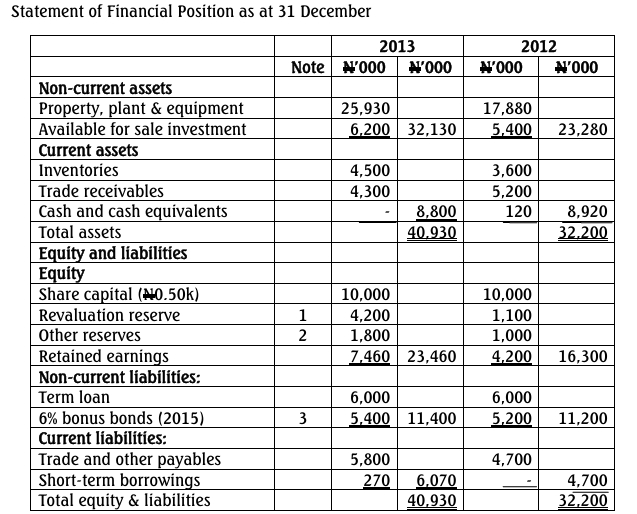
Purity Nigeria Limited is a company that produces table water. The company’s board
plans to restructure its operations with the aim of boosting its market share and
profitability.

The financial results of Purity Nigeria Limited and Bench Mark Co. Limited, which is
the leader in the industry, are as follows:

Operating Statements for the year ended 31 December, 2013

Summarised Statements of Financial Position as at 31 December, 2013.

Required:

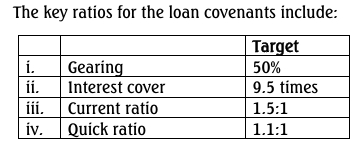
a. Compute the following performance indices for both companies:
i Profit margin
ii. Asset turnover
iii. Returns On Capital Employed (ROCE)
iv. Current ratio
v. Debt-equity ratio (5 Marks)

b. Compare and analyse the performance of the two companies computed in (a)
above and explain what the board of Purity Nigeria Limited needs to do to
achieve their objectives. (10 Marks)

c. What other non-financial measures can influence the decision of the board of
Purity Nigeria Limited? (5 Marks)

Login or create a free account to see answers

Find Related Questions by Tags, levels, etc.
Report an error

You're reporting an error for "PM – Nov 2014 – L2 – Q3 – Divisional Performance Measurement"

FR – Nov 2021 – L2 – Q5 – Statement of Cash Flows (IAS 7)

Prepare a statement of cash flows using the indirect method and analyze current ratios and overdraft reasons for Dongo Limited.

Dongo Limited statement of profit or loss for the year ended December 31, 2020:

Item N’000
Revenue 420,000
Cost of goods sold (99,000)
Gross profit 321,000
Administrative cost (140,800)
Operating profit 180,200
Investment income 8,100
Interest paid (17,120)
Profit before taxation 171,180
Income tax expense (37,000)
Profit for the year 134,180

Dongo Limited statement of financial position as at December 31,

Additional information:
(i) During the year ended December 31, 2020; other comprehensive income was nil.
(ii) A dividend of N85,870,000 was paid during the year ended December 31, 2020.
(iii) There was no disposal of non-current assets during the year.

You are required to:
a. Prepare the statement of cash flows using the indirect method under IAS 7. (10 Marks)
b. Calculate the company’s current ratio as at the year ended December 31, 2019 and 2020. (2 Marks)
c. State THREE technical reasons which accounted for the company’s rise in overdrafts for the TWO years.

Login or create a free account to see answers

Find Related Questions by Tags, levels, etc.

Report an error

You're reporting an error for "FR – Nov 2021 – L2 – Q5 – Statement of Cash Flows (IAS 7)"

FR – Nov 2021 – L2 – Q4 – Presentation of Financial Statements (IAS 1)

Calculate and analyze financial ratios for Onye Nigeria Plc for the years 2019 and 2020.

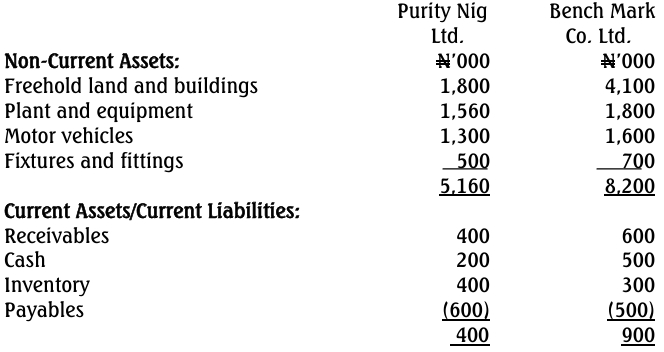
Below are the statements of financial position of Onye Nigeria Plc as at October 31, 2020, and an extract from the statement of profit or loss for the year ended on that date.

Onye Nigeria Plc
Statement of Financial Position as at October 31, 2020

Item 2020 (N’000) 2019 (N’000)
Non-current assets
Property, plant and equipment 8,325 6,435
Current assets
Inventories 2,880 2,205
Trade receivables 5,535 4,860
Cash and bank 360 540
Total Assets 17,100 14,040
Equity and Liabilities
Equity
Ordinary share capital 3,600 3,600
Retained earnings 5,603 3,938
Non-current liabilities
10% loan notes 3,600 2,700
Current liabilities
Trade payables 3,375 3,105
Bank overdraft 495 360
Taxation 135 90
Accrued expenses 292 247
Total Equity and Liabilities 17,100 14,040

Onye Nigeria Plc
Extracts from Statement of Profit or Loss for the Year Ended October 31

Item 2020 (N’000) 2019 (N’000)
Revenue 50,400 43,875
Cost of sales (38,070) (30,713)
Profit before taxation 2,093 1,440

Additional information:

  1. The profit before tax is after charging:
    Item 2020 (N’000) 2019 (N’000)
    Depreciation 1,620 1,620
    Interest on loan note 360 270
    Interest on bank overdraft 68 41
    Audit fees 54 45
  2. The latest industry average ratios are as follows:
    Ratio Industry Average
    ROCE 18.50%
    Net profit margin 4.73%
    Gross profit margin 35.23%
    Assets turnover 3.91 times
    Current ratio 1.90:1
    Quick ratio 1.27:1
    Trade receivables period 52 days
    Trade payables period 49 days
    Inventory turnover 18.30 times
    Gearing ratio 32.71%

Required:
a. Calculate the above ratios of Onye Nigeria Plc for the years 2019 and 2020. (10 Marks)
b. Analyze the performance and liquidity of Onye Nigeria Plc for the year 2020. (5 Marks)
c. Comment on the limitations of using accounting ratios in financial statement analysis. (5 Marks)

Login or create a free account to see answers

Find Related Questions by Tags, levels, etc.
Report an error

You're reporting an error for "FR – Nov 2021 – L2 – Q4 – Presentation of Financial Statements (IAS 1)"

FR – Nov 2015 – L2 – Q2 – Financial Statement Analysis

This question requires calculating financial ratios and analyzing Kack Ltd's financial performance and position for the year ended 31 March 2015 compared to the previous year.

Kack Ltd is a listed company that assembles domestic electrical goods which it then sells to both wholesale and retail customers. Kack Ltd’s management was disappointed in the company’s results for the year ended 31 March 2014. In an attempt to improve performance, the following measures were taken early in the year ended 31 March 2015:

  • A national advertising campaign was undertaken.
  • Rebates to all wholesale customers purchasing goods above set quantity levels were introduced.
  • The assembly of certain lines ceased and was replaced by bought-in completed products. This allowed Kack Ltd to dispose of surplus plant.

Kack Ltd’s summarised financial statements for the year ended 31 March 2015 are set out below:

STATEMENT OF PROFIT OR LOSS AND OTHER COMPREHENSIVE INCOME
FOR THE YEAR ENDED 31 MARCH 2015

Description GHSm
Revenue (25% cash sales) 4,000
Cost of sales (3,450)
Gross profit 550
Operating expenses (370)
Operating profit 180
Profit on disposal of plant (note (i)) 40
Financial charges (20)
Profit before tax 200
Income tax expense (50)
Profit for the year 150

STATEMENT OF FINANCIAL POSITION
AS AT 31 MARCH 2015

Description GHSm GHSm
Non-current assets
Property, plant, and equipment (note (ii)) 550
Current assets
Inventory 250
Trade receivables 360
Bank nil
Total current assets 610
Total assets 1,160
Equity and liabilities
Equity
Stated capital (400m shares) 100
Income surplus 380
Total equity 480
Non-current liabilities
8% loan notes 200
Current liabilities
Bank overdraft 10
Trade payables 430
Current tax payables 40
Total current liabilities 480
Total equity and liabilities 1,160

Below are ratios calculated for the year ended 31 March 2014:

  • Return on year-end capital employed (profit before interest and tax over total assets less current liabilities): 28.1%
  • Net assets (equal to capital employed) turnover: 4 times
  • Gross profit margin: 17%
  • Net profit (before tax) margin: 6.3%
  • Current ratio: 1.6:1
  • Closing inventory holding period: 46 days
  • Trade receivables’ collection period: 45 days
  • Trade payables’ payment period: 55 days
  • Dividend yield: 3.75%
  • Dividend cover: 2 times

Notes:

  1. Kack Ltd received GHS 120 million from the sale of plant that had a carrying amount of GHS 80 million at the date of its sale.
  2. The market price of Kack Ltd’s share throughout the year averaged GHS 3.75 each.
  3. There were no issues or redemption of shares or loans during the year.
  4. Dividends paid during the year ended 31 March 2015 amounted to GHS 90 million, maintaining the same dividend paid in the year ended 31 March 2014.

Required:

a) Calculate ratios for the year ended 31 March 2015 (showing your workings) for Kack Ltd, equivalent to those provided above.
(10 marks)

b) Analyse the financial performance and position of Kack Ltd for the year ended 31 March 2015 compared to the previous year.
(10 marks)
(Total: 20 marks)

Login or create a free account to see answers

Find Related Questions by Tags, levels, etc.

Report an error

You're reporting an error for "FR – Nov 2015 – L2 – Q2 – Financial Statement Analysis"

CR – Mar 2023 – L3 – Q5 – Analysis and interpretation of financial statements Series

Compute financial ratios including operating profit margin, ROCE, inventory turnover, current ratio, capital gearing, and dividend yield for Atiku Ltd and Obi Ltd.

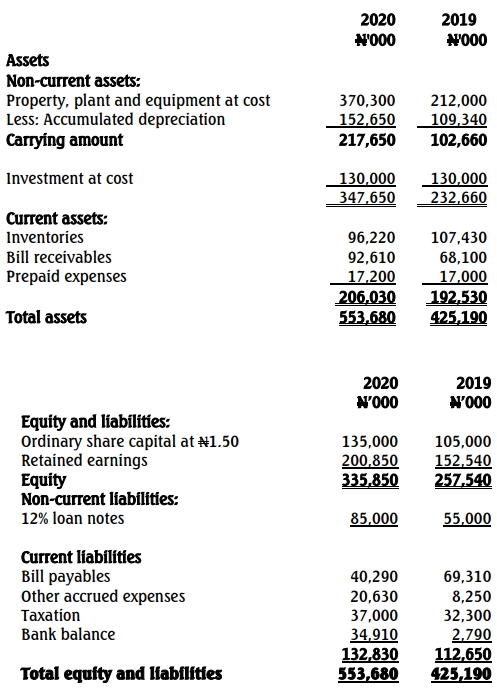
Atiku Ltd operates in the same business sector as Obi Ltd. The directors of Atiku Ltd would like to understand the firm’s strengths and weaknesses relative to Obi Ltd from the latest financial statements of the two entities as set out below:

Summarised Statements of Profit or Loss for the year ended 30 June 2022:


Net profit figures were arrived at after considering the following items:

  • Depreciation and amortisation: Atiku Ltd (GH¢3,110), Obi Ltd (GH¢2,850)
  • Employee benefits: Atiku Ltd (GH¢7,200), Obi Ltd (GH¢6,050)
  • Finance cost: Atiku Ltd (GH¢1,050), Obi Ltd (GH¢880)
  • Provision for current tax: Atiku Ltd (GH¢1,004), Obi Ltd (GH¢925)
  • Deferred tax decrease in provision: Atiku Ltd (GH¢116), Obi Ltd (GH¢55)
  • Current tax under-provision (2021): Atiku Ltd (nil), Obi Ltd (GH¢32)

Additional information: The following ratios have been extracted from the Directors’ Report accompanying the financial statements:

  • Gross profit margin: Atiku Ltd (22%), Obi Ltd (25%)
  • Dividend coverage: Atiku Ltd (4), Obi Ltd (5)
  • Current share price: Atiku Ltd (GH¢2.10), Obi Ltd (GH¢1.55)

Required:
a) Compute the following ratios for both entities for the year ended 30 June 2022: i) Operating profit margin (1.5 marks)
ii) Return on capital employed (capital employed defined as all interest-bearing liabilities and equity) (1.5 marks)
iii) Inventory turnover period (1.5 marks)
iv) Current ratio (1.5 marks)
v) Capital (long-term) gearing (1.5 marks)
vi) Dividend yield (2.5 marks)

b) Write a report to the Chief Executive Officer analyzing Atiku Ltd’s financial performance and position relative to Obi Ltd, for the year ended 30 June 2022. For the report writing, use only the following ratios: operating profit margin, return on capital employed, capital gearing and dividend yield. (10 marks)


Login or create a free account to see answers

Find Related Questions by Tags, levels, etc.
Report an error

You're reporting an error for "CR – Mar 2023 – L3 – Q5 – Analysis and interpretation of financial statements Series"

FA – Aug 2022 – L1 – Q5 – Interpretation of financial statements (Financial Ratios)

Calculation and comparison of financial ratios for two businesses to assess performance, followed by a discussion of which business is performing better.

a) Garu and Gushegu are two businesses that compete in the same market and have been trading for a number of years. The following information relates to their results for the year ended 31 December 2021:

Account Garu (GHȼ’000) Gushegu (GHȼ’000)
Sales 4,455 5,264
Cost of Sales 2,549 2,632
Net Profit 1,075 1,137
Inventory at 1 January 820 518
Inventory at 31 December 1,040 498
Capital Employed 2,428 1,953
Receivables 1,200 1,324
Bank 75 980
Payables 750 720

There are no other current assets or current liabilities.

Required:
Calculate the following ratios for each of the two businesses: i) Return on Capital Employed (ROCE)
ii) Gross Profit Margin
iii) Current Ratio
iv) Liquid (Acid Test) Ratio
v) Inventory Turnover
(10 marks)

b) Using the ratios calculated, discuss which of the two businesses appears to be performing better.
(10 marks)

Login or create a free account to see answers

Find Related Questions by Tags, levels, etc.

Report an error

You're reporting an error for "FA – Aug 2022 – L1 – Q5 – Interpretation of financial statements (Financial Ratios)"

FA – Nov 2021 – L1 – Q5 – Interpretation of financial statements (Financial Ratios)

Calculation and interpretation of financial ratios, including gross profit margin, net profit margin, ROCE, and liquidity ratios, and assessment of liquidity and profitability.

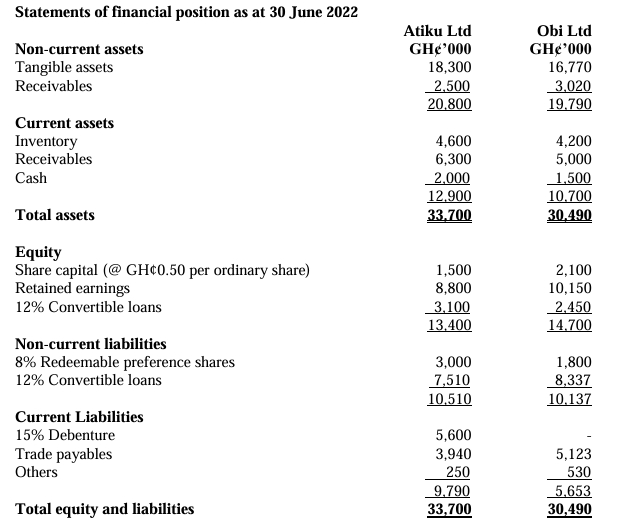
The following summary information relates to two businesses, Danyi and Napo. Both businesses traded in the same market sector for the year ended 31 December 2020.

Statement of Profit or Loss Accounts for the year ended 31 December 2020:

Required:
a) Calculate the following ratios for Danyi and Napo:
i) Gross profit margin
ii) Net profit margin
iii) Return on capital employed (ROCE)
iv) Current ratio
v) Liquid (acid test) ratio
vi) Inventory turnover
(6 marks)

b) Use the ratios calculated in a) to assess:
i) The liquidity of both businesses
ii) The profitability of both businesses
(8 marks)

c) Advise management of both Danyi and Napo on the actions they should now take to improve liquidity and profitability.
(6 marks)


Login or create a free account to see answers

Find Related Questions by Tags, levels, etc.
Report an error

You're reporting an error for "FA – Nov 2021 – L1 – Q5 – Interpretation of financial statements (Financial Ratios)"

PM – Nov 2024 – L2 – Q6 – Divisional Performance Measurement

Comparative analysis of Owerri and Isiekenesi event centers based on financial performance metrics

Omegboje and company is a medium-scale outfit that specializes in the rental business in Owerri and Isiekenesi towns. The company operates a large event center in each city, supplying chairs, tables, and canopies for both outdoor and some indoor events.

Each event center manager has some independence in operations and earns a performance bonus of 10% of sales if they achieve more than the standard return on capital employed (ROCE) of 50%.

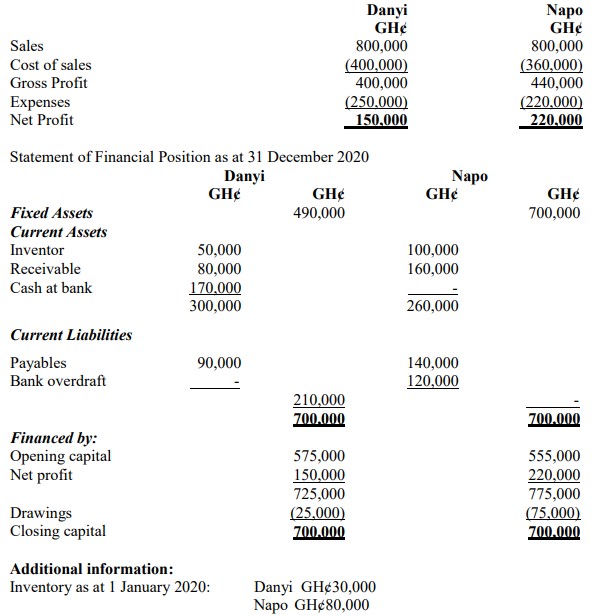
The following financial data is available for the two centers for the years ending December 31, 2020, and 2019:

Additional Information:

  1. Revenue is derived from rentals and ancillary services.
  2. Both centers have a cost of capital of 15%.
  3. Ignore taxation and inflation.

Required:

a. Discuss the relative performance of the two centers based on: i. Return on Capital Employed (ROCE) ii. Residual Income iii. Profit Margin iv. Current Ratio v. Quick Ratio vi. Gearing Ratio vii. Interest Cover
(7 Marks)

b. Compute the performance bonus for the centers (if any), showing your workings.
(4 Marks)

c. Briefly outline the role of a Management Accountant in project management.
(4 Marks)

Login or create a free account to see answers

Find Related Questions by Tags, levels, etc.
Report an error

You're reporting an error for "PM – Nov 2024 – L2 – Q6 – Divisional Performance Measurement"

PM – Nov 2014 – L2 – Q3 – Divisional Performance Measurement

Compare financial performance of Purity Nigeria Ltd. and Benchmark Co. Ltd using key financial ratios and offer strategic improvement recommendations.

Purity Nigeria Limited is a company that produces table water. The company’s board
plans to restructure its operations with the aim of boosting its market share and
profitability.

The financial results of Purity Nigeria Limited and Bench Mark Co. Limited, which is
the leader in the industry, are as follows:

Operating Statements for the year ended 31 December, 2013

Summarised Statements of Financial Position as at 31 December, 2013.

Required:

a. Compute the following performance indices for both companies:
i Profit margin
ii. Asset turnover
iii. Returns On Capital Employed (ROCE)
iv. Current ratio
v. Debt-equity ratio (5 Marks)

b. Compare and analyse the performance of the two companies computed in (a)
above and explain what the board of Purity Nigeria Limited needs to do to
achieve their objectives. (10 Marks)

c. What other non-financial measures can influence the decision of the board of
Purity Nigeria Limited? (5 Marks)

Login or create a free account to see answers

Find Related Questions by Tags, levels, etc.

Report an error

You're reporting an error for "PM – Nov 2014 – L2 – Q3 – Divisional Performance Measurement"

FR – Nov 2021 – L2 – Q5 – Statement of Cash Flows (IAS 7)

Prepare a statement of cash flows using the indirect method and analyze current ratios and overdraft reasons for Dongo Limited.

Dongo Limited statement of profit or loss for the year ended December 31, 2020:

Item N’000
Revenue 420,000
Cost of goods sold (99,000)
Gross profit 321,000
Administrative cost (140,800)
Operating profit 180,200
Investment income 8,100
Interest paid (17,120)
Profit before taxation 171,180
Income tax expense (37,000)
Profit for the year 134,180

Dongo Limited statement of financial position as at December 31,

Additional information:
(i) During the year ended December 31, 2020; other comprehensive income was nil.
(ii) A dividend of N85,870,000 was paid during the year ended December 31, 2020.
(iii) There was no disposal of non-current assets during the year.

You are required to:
a. Prepare the statement of cash flows using the indirect method under IAS 7. (10 Marks)
b. Calculate the company’s current ratio as at the year ended December 31, 2019 and 2020. (2 Marks)
c. State THREE technical reasons which accounted for the company’s rise in overdrafts for the TWO years.

Login or create a free account to see answers

Find Related Questions by Tags, levels, etc.

Report an error

You're reporting an error for "FR – Nov 2021 – L2 – Q5 – Statement of Cash Flows (IAS 7)"

FR – Nov 2021 – L2 – Q4 – Presentation of Financial Statements (IAS 1)

Calculate and analyze financial ratios for Onye Nigeria Plc for the years 2019 and 2020.

Below are the statements of financial position of Onye Nigeria Plc as at October 31, 2020, and an extract from the statement of profit or loss for the year ended on that date.

Onye Nigeria Plc
Statement of Financial Position as at October 31, 2020

Item 2020 (N’000) 2019 (N’000)
Non-current assets
Property, plant and equipment 8,325 6,435
Current assets
Inventories 2,880 2,205
Trade receivables 5,535 4,860
Cash and bank 360 540
Total Assets 17,100 14,040
Equity and Liabilities
Equity
Ordinary share capital 3,600 3,600
Retained earnings 5,603 3,938
Non-current liabilities
10% loan notes 3,600 2,700
Current liabilities
Trade payables 3,375 3,105
Bank overdraft 495 360
Taxation 135 90
Accrued expenses 292 247
Total Equity and Liabilities 17,100 14,040

Onye Nigeria Plc
Extracts from Statement of Profit or Loss for the Year Ended October 31

Item 2020 (N’000) 2019 (N’000)
Revenue 50,400 43,875
Cost of sales (38,070) (30,713)
Profit before taxation 2,093 1,440

Additional information:

  1. The profit before tax is after charging:
    Item 2020 (N’000) 2019 (N’000)
    Depreciation 1,620 1,620
    Interest on loan note 360 270
    Interest on bank overdraft 68 41
    Audit fees 54 45
  2. The latest industry average ratios are as follows:
    Ratio Industry Average
    ROCE 18.50%
    Net profit margin 4.73%
    Gross profit margin 35.23%
    Assets turnover 3.91 times
    Current ratio 1.90:1
    Quick ratio 1.27:1
    Trade receivables period 52 days
    Trade payables period 49 days
    Inventory turnover 18.30 times
    Gearing ratio 32.71%

Required:
a. Calculate the above ratios of Onye Nigeria Plc for the years 2019 and 2020. (10 Marks)
b. Analyze the performance and liquidity of Onye Nigeria Plc for the year 2020. (5 Marks)
c. Comment on the limitations of using accounting ratios in financial statement analysis. (5 Marks)

Login or create a free account to see answers

Find Related Questions by Tags, levels, etc.

Report an error

You're reporting an error for "FR – Nov 2021 – L2 – Q4 – Presentation of Financial Statements (IAS 1)"

FR – Nov 2015 – L2 – Q2 – Financial Statement Analysis

This question requires calculating financial ratios and analyzing Kack Ltd's financial performance and position for the year ended 31 March 2015 compared to the previous year.

Kack Ltd is a listed company that assembles domestic electrical goods which it then sells to both wholesale and retail customers. Kack Ltd’s management was disappointed in the company’s results for the year ended 31 March 2014. In an attempt to improve performance, the following measures were taken early in the year ended 31 March 2015:

  • A national advertising campaign was undertaken.
  • Rebates to all wholesale customers purchasing goods above set quantity levels were introduced.
  • The assembly of certain lines ceased and was replaced by bought-in completed products. This allowed Kack Ltd to dispose of surplus plant.

Kack Ltd’s summarised financial statements for the year ended 31 March 2015 are set out below:

STATEMENT OF PROFIT OR LOSS AND OTHER COMPREHENSIVE INCOME
FOR THE YEAR ENDED 31 MARCH 2015

Description GHSm
Revenue (25% cash sales) 4,000
Cost of sales (3,450)
Gross profit 550
Operating expenses (370)
Operating profit 180
Profit on disposal of plant (note (i)) 40
Financial charges (20)
Profit before tax 200
Income tax expense (50)
Profit for the year 150

STATEMENT OF FINANCIAL POSITION
AS AT 31 MARCH 2015

Description GHSm GHSm
Non-current assets
Property, plant, and equipment (note (ii)) 550
Current assets
Inventory 250
Trade receivables 360
Bank nil
Total current assets 610
Total assets 1,160
Equity and liabilities
Equity
Stated capital (400m shares) 100
Income surplus 380
Total equity 480
Non-current liabilities
8% loan notes 200
Current liabilities
Bank overdraft 10
Trade payables 430
Current tax payables 40
Total current liabilities 480
Total equity and liabilities 1,160

Below are ratios calculated for the year ended 31 March 2014:

  • Return on year-end capital employed (profit before interest and tax over total assets less current liabilities): 28.1%
  • Net assets (equal to capital employed) turnover: 4 times
  • Gross profit margin: 17%
  • Net profit (before tax) margin: 6.3%
  • Current ratio: 1.6:1
  • Closing inventory holding period: 46 days
  • Trade receivables’ collection period: 45 days
  • Trade payables’ payment period: 55 days
  • Dividend yield: 3.75%
  • Dividend cover: 2 times

Notes:

  1. Kack Ltd received GHS 120 million from the sale of plant that had a carrying amount of GHS 80 million at the date of its sale.
  2. The market price of Kack Ltd’s share throughout the year averaged GHS 3.75 each.
  3. There were no issues or redemption of shares or loans during the year.
  4. Dividends paid during the year ended 31 March 2015 amounted to GHS 90 million, maintaining the same dividend paid in the year ended 31 March 2014.

Required:

a) Calculate ratios for the year ended 31 March 2015 (showing your workings) for Kack Ltd, equivalent to those provided above.
(10 marks)

b) Analyse the financial performance and position of Kack Ltd for the year ended 31 March 2015 compared to the previous year.
(10 marks)
(Total: 20 marks)

Login or create a free account to see answers

Find Related Questions by Tags, levels, etc.

Report an error

You're reporting an error for "FR – Nov 2015 – L2 – Q2 – Financial Statement Analysis"

CR – Mar 2023 – L3 – Q5 – Analysis and interpretation of financial statements Series

Compute financial ratios including operating profit margin, ROCE, inventory turnover, current ratio, capital gearing, and dividend yield for Atiku Ltd and Obi Ltd.

Atiku Ltd operates in the same business sector as Obi Ltd. The directors of Atiku Ltd would like to understand the firm’s strengths and weaknesses relative to Obi Ltd from the latest financial statements of the two entities as set out below:

Summarised Statements of Profit or Loss for the year ended 30 June 2022:


Net profit figures were arrived at after considering the following items:

  • Depreciation and amortisation: Atiku Ltd (GH¢3,110), Obi Ltd (GH¢2,850)
  • Employee benefits: Atiku Ltd (GH¢7,200), Obi Ltd (GH¢6,050)
  • Finance cost: Atiku Ltd (GH¢1,050), Obi Ltd (GH¢880)
  • Provision for current tax: Atiku Ltd (GH¢1,004), Obi Ltd (GH¢925)
  • Deferred tax decrease in provision: Atiku Ltd (GH¢116), Obi Ltd (GH¢55)
  • Current tax under-provision (2021): Atiku Ltd (nil), Obi Ltd (GH¢32)

Additional information: The following ratios have been extracted from the Directors’ Report accompanying the financial statements:

  • Gross profit margin: Atiku Ltd (22%), Obi Ltd (25%)
  • Dividend coverage: Atiku Ltd (4), Obi Ltd (5)
  • Current share price: Atiku Ltd (GH¢2.10), Obi Ltd (GH¢1.55)

Required:
a) Compute the following ratios for both entities for the year ended 30 June 2022: i) Operating profit margin (1.5 marks)
ii) Return on capital employed (capital employed defined as all interest-bearing liabilities and equity) (1.5 marks)
iii) Inventory turnover period (1.5 marks)
iv) Current ratio (1.5 marks)
v) Capital (long-term) gearing (1.5 marks)
vi) Dividend yield (2.5 marks)

b) Write a report to the Chief Executive Officer analyzing Atiku Ltd’s financial performance and position relative to Obi Ltd, for the year ended 30 June 2022. For the report writing, use only the following ratios: operating profit margin, return on capital employed, capital gearing and dividend yield. (10 marks)


Login or create a free account to see answers

Find Related Questions by Tags, levels, etc.

Report an error

You're reporting an error for "CR – Mar 2023 – L3 – Q5 – Analysis and interpretation of financial statements Series"

FA – Aug 2022 – L1 – Q5 – Interpretation of financial statements (Financial Ratios)

Calculation and comparison of financial ratios for two businesses to assess performance, followed by a discussion of which business is performing better.

a) Garu and Gushegu are two businesses that compete in the same market and have been trading for a number of years. The following information relates to their results for the year ended 31 December 2021:

Account Garu (GHȼ’000) Gushegu (GHȼ’000)
Sales 4,455 5,264
Cost of Sales 2,549 2,632
Net Profit 1,075 1,137
Inventory at 1 January 820 518
Inventory at 31 December 1,040 498
Capital Employed 2,428 1,953
Receivables 1,200 1,324
Bank 75 980
Payables 750 720

There are no other current assets or current liabilities.

Required:
Calculate the following ratios for each of the two businesses: i) Return on Capital Employed (ROCE)
ii) Gross Profit Margin
iii) Current Ratio
iv) Liquid (Acid Test) Ratio
v) Inventory Turnover
(10 marks)

b) Using the ratios calculated, discuss which of the two businesses appears to be performing better.
(10 marks)

Login or create a free account to see answers

Find Related Questions by Tags, levels, etc.

Report an error

You're reporting an error for "FA – Aug 2022 – L1 – Q5 – Interpretation of financial statements (Financial Ratios)"

FA – Nov 2021 – L1 – Q5 – Interpretation of financial statements (Financial Ratios)

Calculation and interpretation of financial ratios, including gross profit margin, net profit margin, ROCE, and liquidity ratios, and assessment of liquidity and profitability.

The following summary information relates to two businesses, Danyi and Napo. Both businesses traded in the same market sector for the year ended 31 December 2020.

Statement of Profit or Loss Accounts for the year ended 31 December 2020:

Required:
a) Calculate the following ratios for Danyi and Napo:
i) Gross profit margin
ii) Net profit margin
iii) Return on capital employed (ROCE)
iv) Current ratio
v) Liquid (acid test) ratio
vi) Inventory turnover
(6 marks)

b) Use the ratios calculated in a) to assess:
i) The liquidity of both businesses
ii) The profitability of both businesses
(8 marks)

c) Advise management of both Danyi and Napo on the actions they should now take to improve liquidity and profitability.
(6 marks)


Login or create a free account to see answers

Find Related Questions by Tags, levels, etc.

Report an error

You're reporting an error for "FA – Nov 2021 – L1 – Q5 – Interpretation of financial statements (Financial Ratios)"

error: Content is protected !!
Oops!

This feature is only available in selected plans.

Click on the login button below to login if you’re already subscribed to a plan or click on the upgrade button below to upgrade your current plan.

If you’re not subscribed to a plan, click on the button below to choose a plan