Question Tag: Central Tendency

Search 500 + past questions and counting.
  • Filter by Professional Bodies

  • Filter by Subject

  • Filter by Series

  • Filter by Topics

  • Filter by Levels

QTB – May 2017 – L1 – SA – Q9 – Data Collection Analysis

This question identifies the reasons why the mean is preferred for statistical calculations.

The mean is the most commonly used statistics for further statistical calculations because it:
A. Tends to lie at the centre of a set of data
B. Is easy to calculate
C. Takes all observations in the data into consideration
D. Is the most popular
E. Is not affected by extreme values in the data

Login or create a free account to see answers

Find Related Questions by Tags, levels, etc.

Report an error

You're reporting an error for "QTB – May 2017 – L1 – SA – Q9 – Data Collection Analysis"

QT – May 2016 – L1 – Q1 – Measures of Central Tendency

This question calculates measures of central tendency and dispersion for fuel gallon consumption in 2010, followed by an interpretation of the results.

Mr. Boo, a Chartered Accountant, is investigating the distribution of the number of fuel gallons consumed per day in the year 2010. He conducted a survey on the number of fuel gallons consumed per day and recorded the following results:

NUMBER OF FUEL GALLONS PERCENTAGE OF CONSUMPTION
0 but under 5 38%
5 but under 10 25%
10 but under 15 16%
15 but under 20 21%

Required:

a) Calculate the following measures of central tendency: i) Mean (3 marks) ii) Median (3 marks) iii) Mode (3 marks)

b) Compute the following measures of dispersion and skewness: i) Inter-Quartile Range (3 marks) ii) Variance (3 marks) iii) Appropriate coefficient of skewness (3 marks)

c) Using (a) and (b) above, comment on the distribution of the number of fuel gallons consumed per day in 2010 (2 marks).

(Total: 20 marks)

Login or create a free account to see answers

Find Related Questions by Tags, levels, etc.

Report an error

You're reporting an error for "QT – May 2016 – L1 – Q1 – Measures of Central Tendency"

QT – Nov 2016 – L1 – Q5 – Measures of Central Tendency

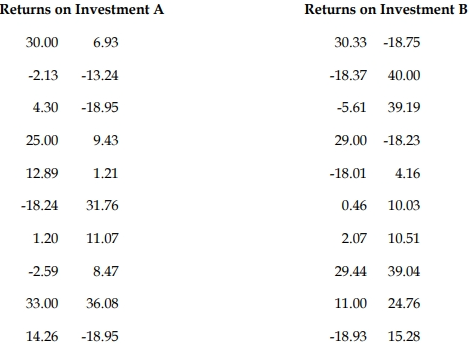
Analyze the returns on two investments using central tendency, dispersion, and provide a decision based on the results.

Suppose that Mr. Kuu, a retired chartered accountant, is facing a decision about where to invest the remaining small fortune after deducting the anticipated expenses for the next year from his consultancy earnings. An investment analyst has suggested two types of investments, and to help make the decision, he obtained some rates of return from each type. He would like to know what he can expect by way of the return on his investment, as well as other types of information, such as whether the rates are spread out over a wide range (making the investment risky) or are grouped tightly together (indicating a relatively low risk). The returns for the two types of investments are listed below:

If he decides to group the returns according to classes 19-10, 9-0, 1-10, 11-20, 21-30, 31-40 :


Required:

a) Draw histograms for each set of returns. (5 marks)
b) Compute the following measures of central tendency for the set of returns:
i) Mean (3 marks)
ii) Median (3 marks)
iii) Mode (3 marks)
c) Compute the following measures of spread for the set of returns:
i) Standard deviation (3 marks)
ii) Coefficient of variation (2 marks)
d) Based on (a), (b), and (c), which investment should Mr. Kuu choose and why? (1 mark)

Login or create a free account to see answers

Find Related Questions by Tags, levels, etc.

Report an error

You're reporting an error for "QT – Nov 2016 – L1 – Q5 – Measures of Central Tendency"

QT – May 2018 – L1 – Q6b – Measures of Central Tendency

Calculation of central tendency measures and coefficient of variation based on bi-weekly income data.


The table below shows the range of bi-weekly income of a sample of 50 accountants of a multi-national accounting firm:

Range of Income (GH₵) Number of Accountants
80 and Less than 100 5
100 and less than 120 4
120 and less than 150 12
150 and less than 170 7
170 and less than 200 8
200 and less than 250 9
250 and less than 300 5

Required:
i) Compute all the THREE measures of central tendency of the range of income and comment on the distribution. (8 marks)
ii) Compute the coefficient of variation of the range of income of the accountants. (7 marks)
iii) Interpret your answer in (ii). (1 mark)

Login or create a free account to see answers

Find Related Questions by Tags, levels, etc.

Report an error

You're reporting an error for "QT – May 2018 – L1 – Q6b – Measures of Central Tendency"

QT – May 2018 – L1 – Q6a – Measures of Central Tendency

Explanation of measures of central tendency and dispersion with examples.

i) Distinguish between measures of central tendency and measures of dispersion (or variation). (2 marks)

ii) State TWO examples of measures of central tendency. (1 mark)

iii) State TWO examples of measures of dispersion (or variation). (1 mark)

Login or create a free account to see answers

Find Related Questions by Tags, levels, etc.

Report an error

You're reporting an error for "QT – May 2018 – L1 – Q6a – Measures of Central Tendency"

QT – Nov 2018 – L1 – Q4a – Measures of Central Tendency

Explain when the mode is preferred as a measure of central tendency over the mean or median.

When is the mode preferred to the mean or the median as a measure of central tendency?

Login or create a free account to see answers

Find Related Questions by Tags, levels, etc.

Report an error

You're reporting an error for "QT – Nov 2018 – L1 – Q4a – Measures of Central Tendency"

error: Content is protected !!
Oops!

This feature is only available in selected plans.

Click on the login button below to login if you’re already subscribed to a plan or click on the upgrade button below to upgrade your current plan.

If you’re not subscribed to a plan, click on the button below to choose a plan